Blend Results Presentation Deck
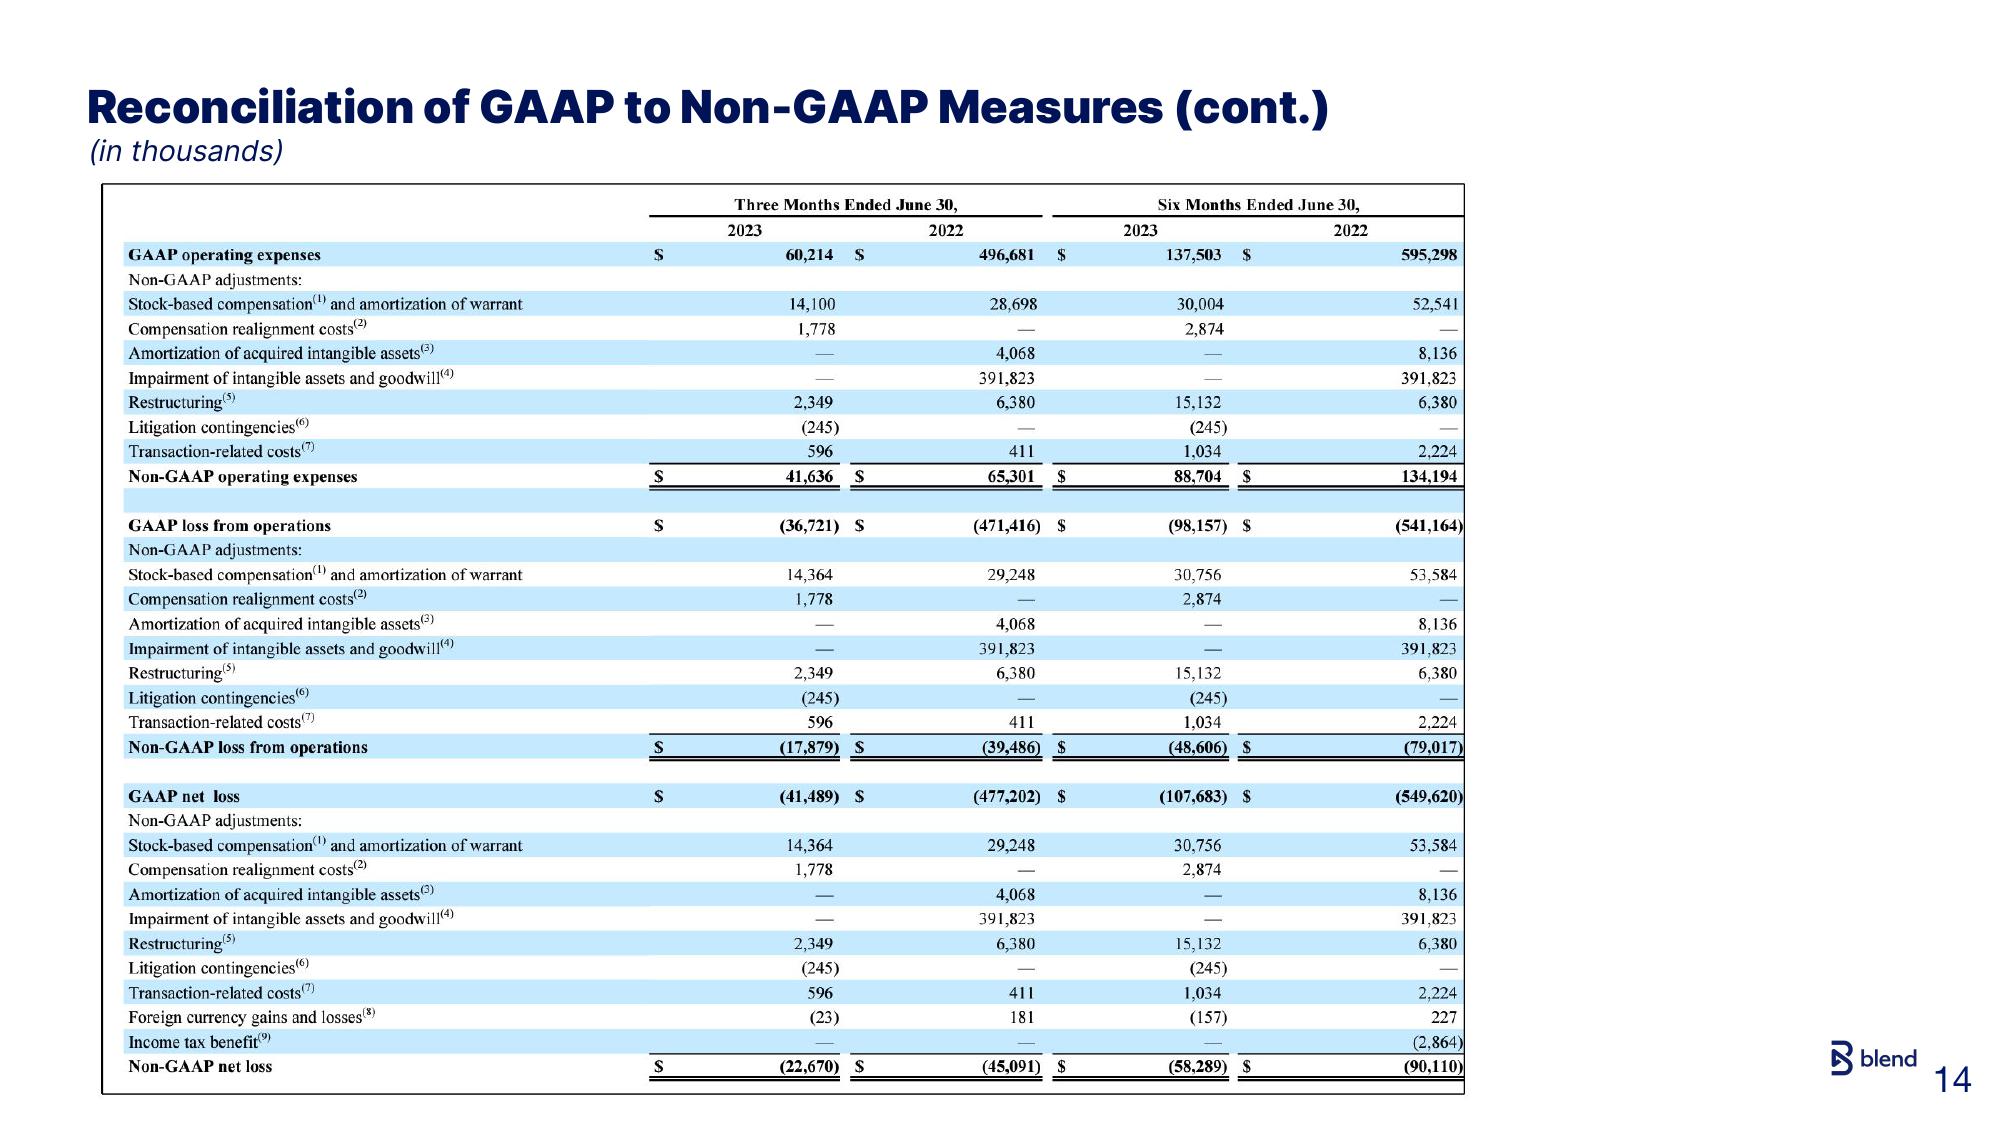
Reconciliation of GAAP to Non-GAAP Measures (cont.)
(in thousands)
GAAP operating expenses
Non-GAAP adjustments:
Stock-based compensation and amortization of warrant
Compensation realignment costs (²)
Amortization of acquired intangible assets (3)
Impairment of intangible assets and goodwill(4)
Restructuring (5)
Litigation contingencies)
Transaction-related costs (7)
Non-GAAP operating expenses
GAAP loss from operations
Non-GAAP adjustments:
Stock-based compensation and amortization of warrant
Compensation realignment costs(²)
Amortization of acquired intangible assets(3)
Impairment of intangible assets and goodwill(4)
Restructuring (5)
Litigation contingencies)
Transaction-related costs(7)
Non-GAAP loss from operations
GAAP net loss
Non-GAAP adjustments:
Stock-based compensation and amortization of warrant
(1)
Compensation realignment costs(2)
Amortization of acquired intangible assets(3)
Impairment of intangible assets and goodwill(4)
Restructuring (5)
Litigation contingencies(6)
Transaction-related costs (7)
Foreign currency gains and losses (8)
Income tax benefit(9)
Non-GAAP net loss
S
$
$
S
S
S
Three Months Ended June 30,
2023
2022
60,214 $
14,100
1,778
2,349
(245)
596
41,636 $
(36,721) S
14,364
1,778
2,349
(245)
596
(17,879) S
(41,489) S
14,364
1,778
2,349
(245)
596
(23)
(22,670) S
496,681 $
28,698
4,068
391,823
6,380
411
65,301
(471,416) $
29,248
4,068
391,823
6,380
411
(39,486) $
$
(477,202) $
29,248
4,068
391,823
6,380
411
181
(45,091) $
Six Months Ended June 30,
2022
2023
137,503 $
30,004
2,874
15,132
(245)
1,034
88,704 $
(98,157) S
30,756
2,874
15,132
(245)
1,034
(48,606) S
(107,683) S
30,756
2,874
15,132
(245)
1,034
(157)
(58,289) $
595,298
52,541
8.136
391,823
6,380
2,224
134,194
(541,164)
53,584
8,136
391,823
6,380
2,224
(79,017)
(549,620)
53,584
8,136
391,823
6,380
2,224
227
(2,864)
(90,110)
blend
14View entire presentation