Overstock Results Presentation Deck
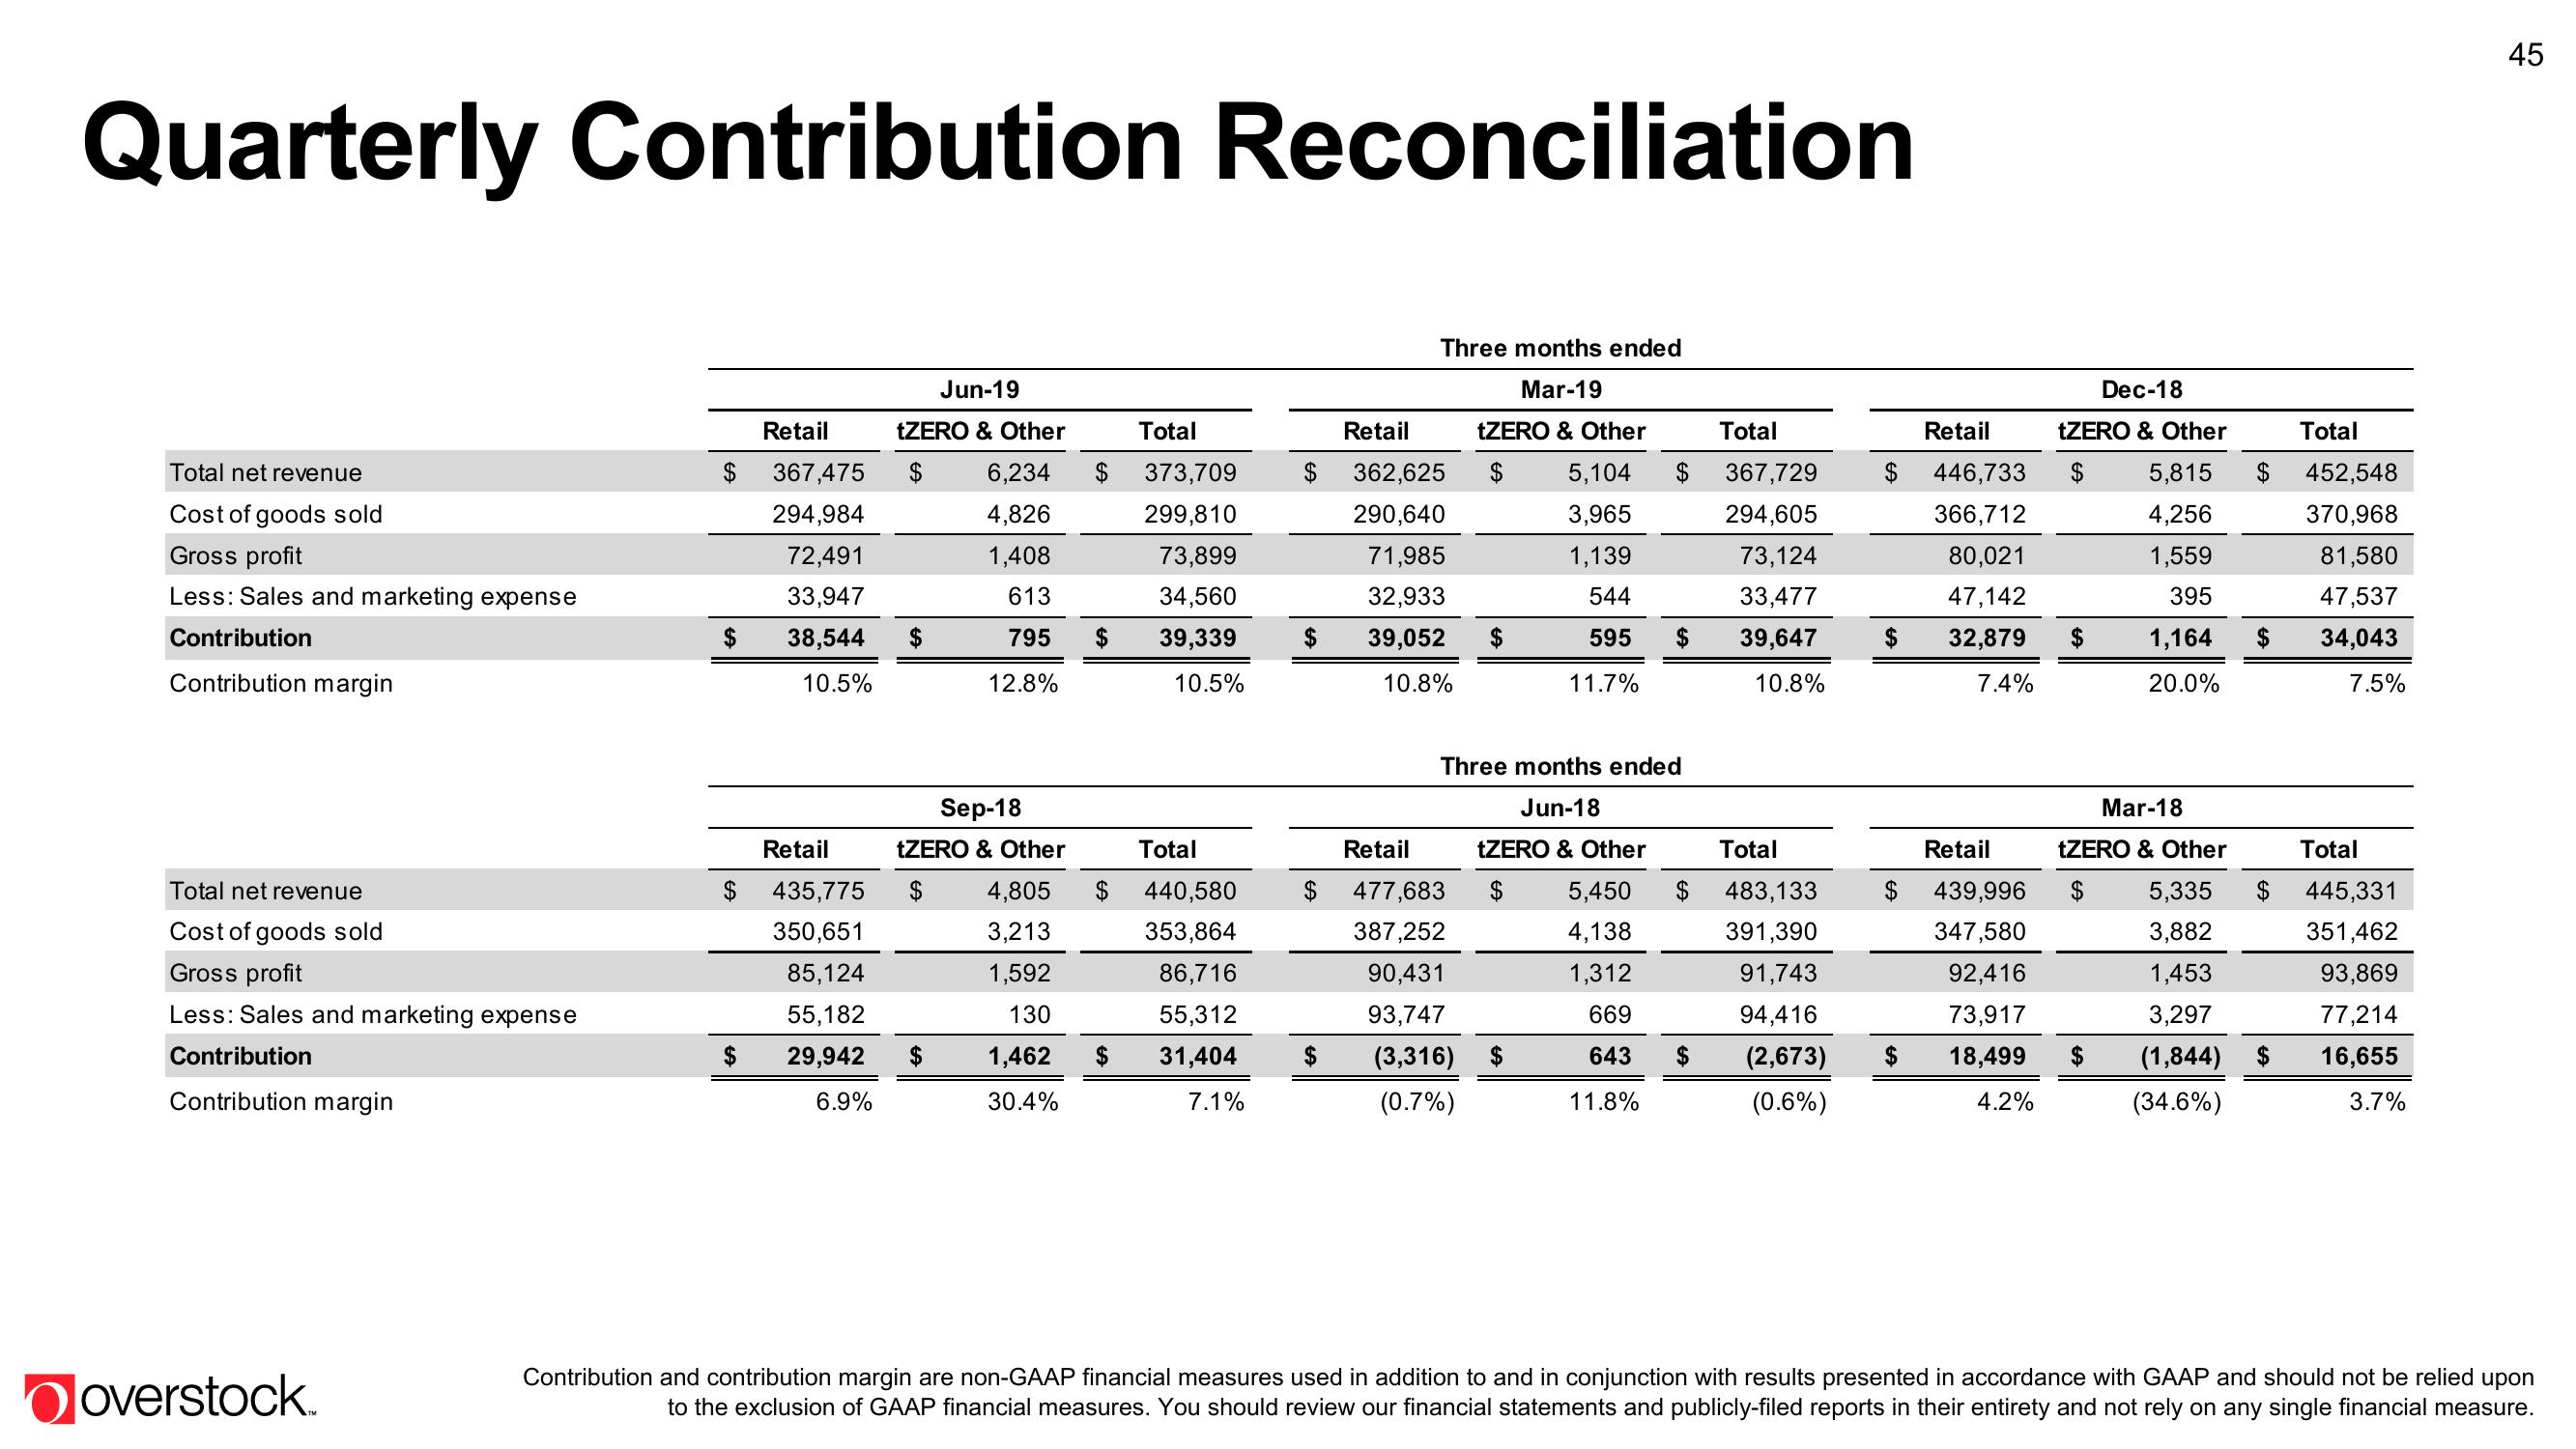
Quarterly Contribution Reconciliation
Total net revenue
Cost of goods sold
Gross profit
Less: Sales and marketing expense
Contribution
Contribution margin
Total net revenue
Cost of goods sold
Gross profit
Less: Sales and marketing expense
Contribution
Contribution margin
overstock.
$
$
$
$
Retail
367,475
294,984
Jun-19
tZERO & Other
$
72,491
33,947
38,544 $
10.5%
Retail
435,775
350,651
85,124
55,182
29,942
6.9%
6,234
4,826
1,408
613
795
12.8%
Sep-18
tZERO & Other
$ 4,805
3,213
1,592
130
1,462
30.4%
$
$
$
Total
373,709 $
299,810
73,899
34,560
39,339
10.5%
Total
$ 440,580
353,864
86,716
55,312
31,404
7.1%
$
$
Three months ended
Mar-19
tZERO & Other
Retail
362,625
290,640
71,985
32,933
39,052 $
10.8%
Retail
477,683
387,252
90,431
93,747
(3,316)
(0.7%)
5,104
3,965
1,139
544
595
11.7%
$
$
Three months ended
Jun-18
tZERO & Other
5,450
4,138
1,312
669
643
11.8%
$
Total
367,729
294,605
73,124
33,477
39,647
10.8%
Total
$ 483,133
391,390
91,743
94,416
(2,673)
(0.6%)
$
Retail
$ 446,733
366,712
80,021
47,142
32,879 $
7.4%
$
$
$
Dec-18
$
tZERO & Other
5,815
4,256
1,559
395
1,164
20.0%
Retail
439,996
347,580
92,416
73,917
$
18,499 $
4.2%
$
Mar-18
tZERO & Other
$ 5,335 $
3,882
1,453
3,297
(1,844)
(34.6%)
$
Total
452,548
370,968
81,580
47,537
34,043
7.5%
Total
445,331
351,462
93,869
77,214
16,655
3.7%
45
Contribution and contribution margin are non-GAAP financial measures used in addition to and in conjunction with results presented in accordance with GAAP and should not be relied upon
to the exclusion of GAAP financial measures. You should review our financial statements and publicly-filed reports in their entirety and not rely on any single financial measure.View entire presentation