Samsara Investor Day Presentation Deck
69
Ⓒ Samsara Inc.
samsara
GAAP G&A expense
Less: Stock-based compensation
expense-related charges
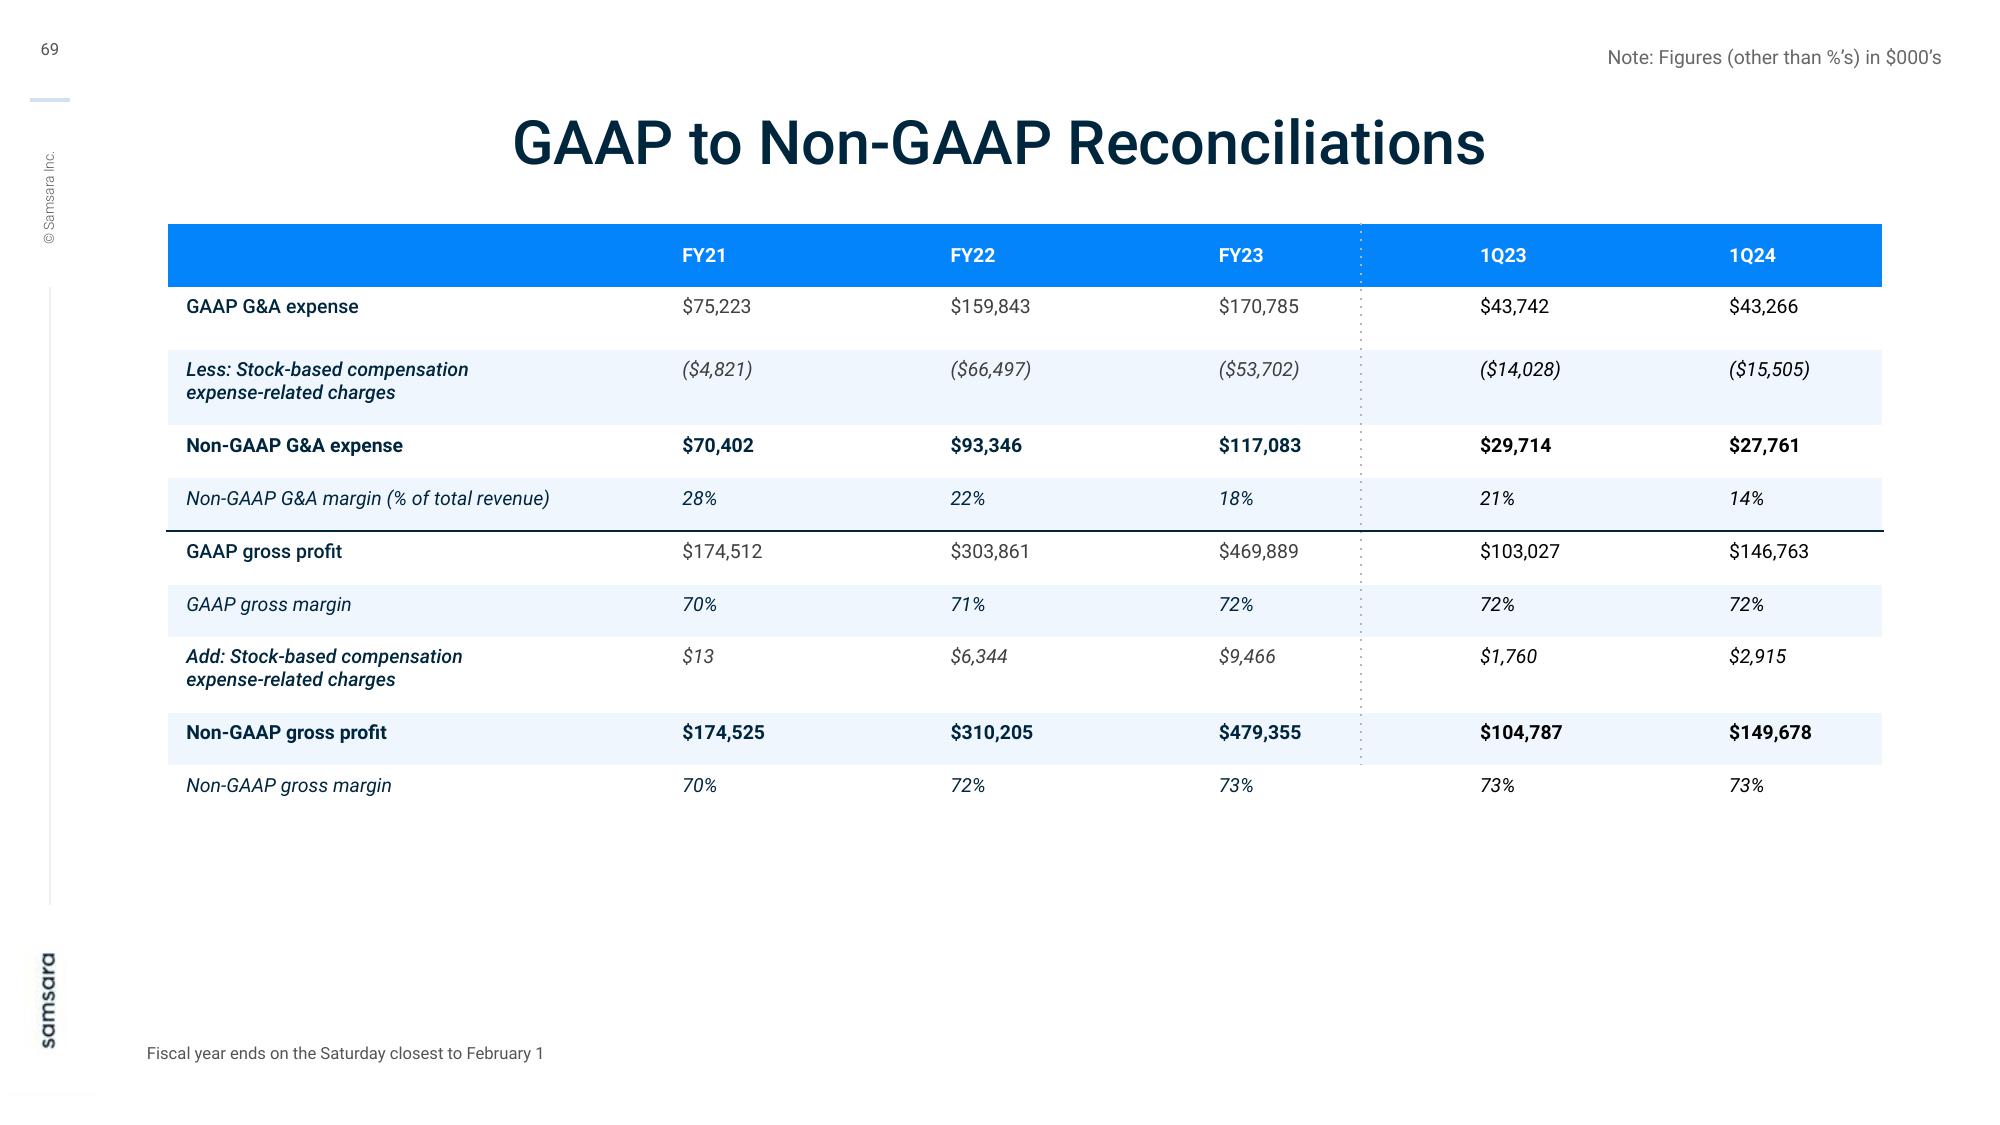
GAAP to Non-GAAP Reconciliations
Non-GAAP G&A expense
Non-GAAP G&A margin (% of total revenue)
GAAP gross profit
GAAP gross margin
Add: Stock-based compensation
expense-related charges
Non-GAAP gross profit
Non-GAAP gross margin
Fiscal year ends on the Saturday closest to February 1
FY21
$75,223
($4,821)
$70,402
28%
$174,512
70%
$13
$174,525
70%
FY22
$159,843
($66,497)
$93,346
22%
$303,861
71%
$6,344
$310,205
72%
FY23
$170,785
($53,702)
$117,083
18%
$469,889
72%
$9,466
$479,355
73%
1Q23
$43,742
($14,028)
$29,714
21%
$103,027
72%
$1,760
$104,787
73%
Note: Figures (other than %'s) in $000's
1024
$43,266
($15,505)
$27,761
14%
$146,763
72%
$2,915
$149,678
73%View entire presentation