DraftKings Results Presentation Deck
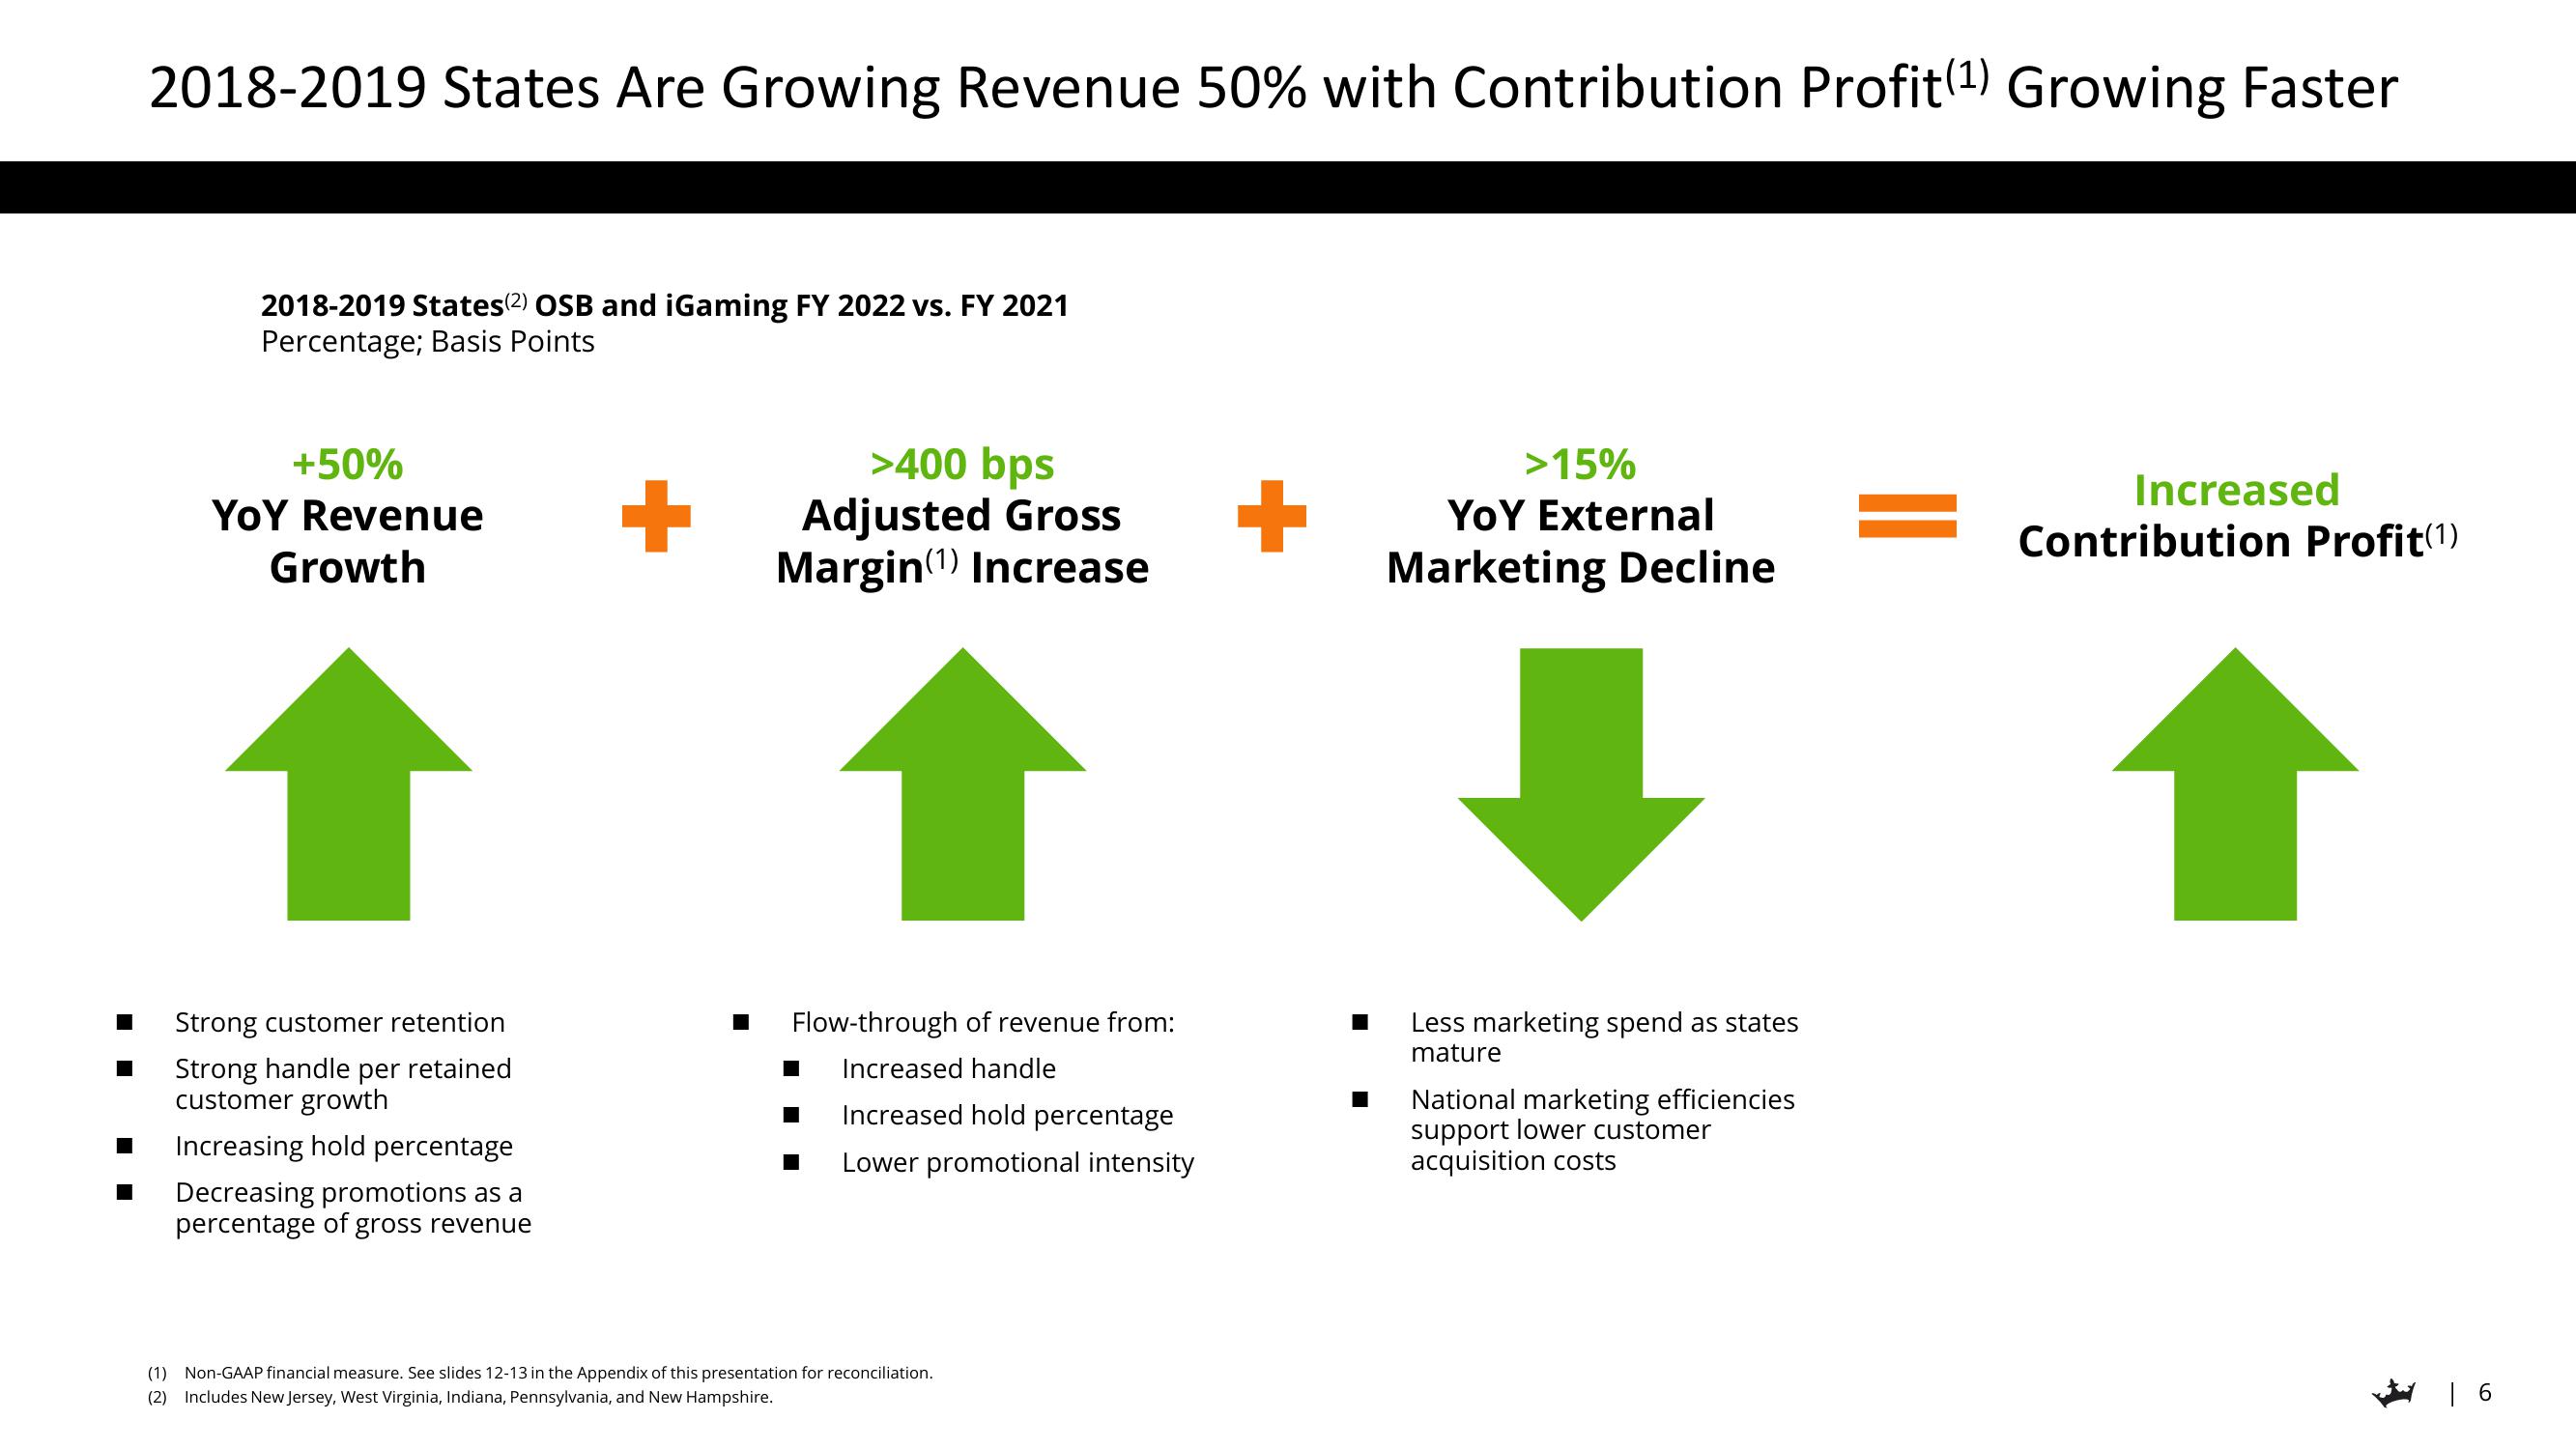
2018-2019 States Are Growing Revenue 50% with Contribution Profit (¹) Growing Faster
2018-2019 States (2) OSB and iGaming FY 2022 vs. FY 2021
Percentage; Basis Points
+50%
YOY Revenue
Growth
■ Strong customer retention
Strong handle per retained
customer growth
Increasing hold percentage
Decreasing promotions as a
percentage of gross revenue
+
>400 bps
Adjusted Gross
Margin(¹) Increase
Flow-through of revenue from:
Increased handle
Increased hold percentage
Lower promotional intensity
(1) Non-GAAP financial measure. See slides 12-13 in the Appendix of this presentation for reconciliation.
(2) Includes New Jersey, West Virginia, Indiana, Pennsylvania, and New Hampshire.
+
>15%
YOY External
Marketing Decline
Less marketing spend as states
mature
National marketing efficiencies
support lower customer
acquisition costs
Increased
Contribution Profit(1)
| 6View entire presentation