AT&T Results Presentation Deck
2Q21 Financial Summary
$ in billions, except EPS
7
Adjusted EPS
Adj. Ol Margin
$0.83 $0.89
21.9%
20.2%
O
2Q20 2Q21
Reported EPS
Adjustments:
Impairments
Amortization of intangibles
Actuarial loss on benefit plans
Other adjustments, net
Adjusted EPS
Revenues
$41.0
$44.0
2Q20 2Q21
2Q20
$0.17
$0.32
$0.24
$0.10
$0.83
Cash from Ops
Free Cash Flow
CAPEX
$12.1
$7.6
July 22, 2021/ © 2021 AT&T Intellectual Property - AT&T Proprietary
$4.5
$10.9
$7.0
$4.0
2Q20 2Q21
2Q21
$0.21
$0.52
$0.12
$0.02
$0.02
$0.89
Solid revenue growth
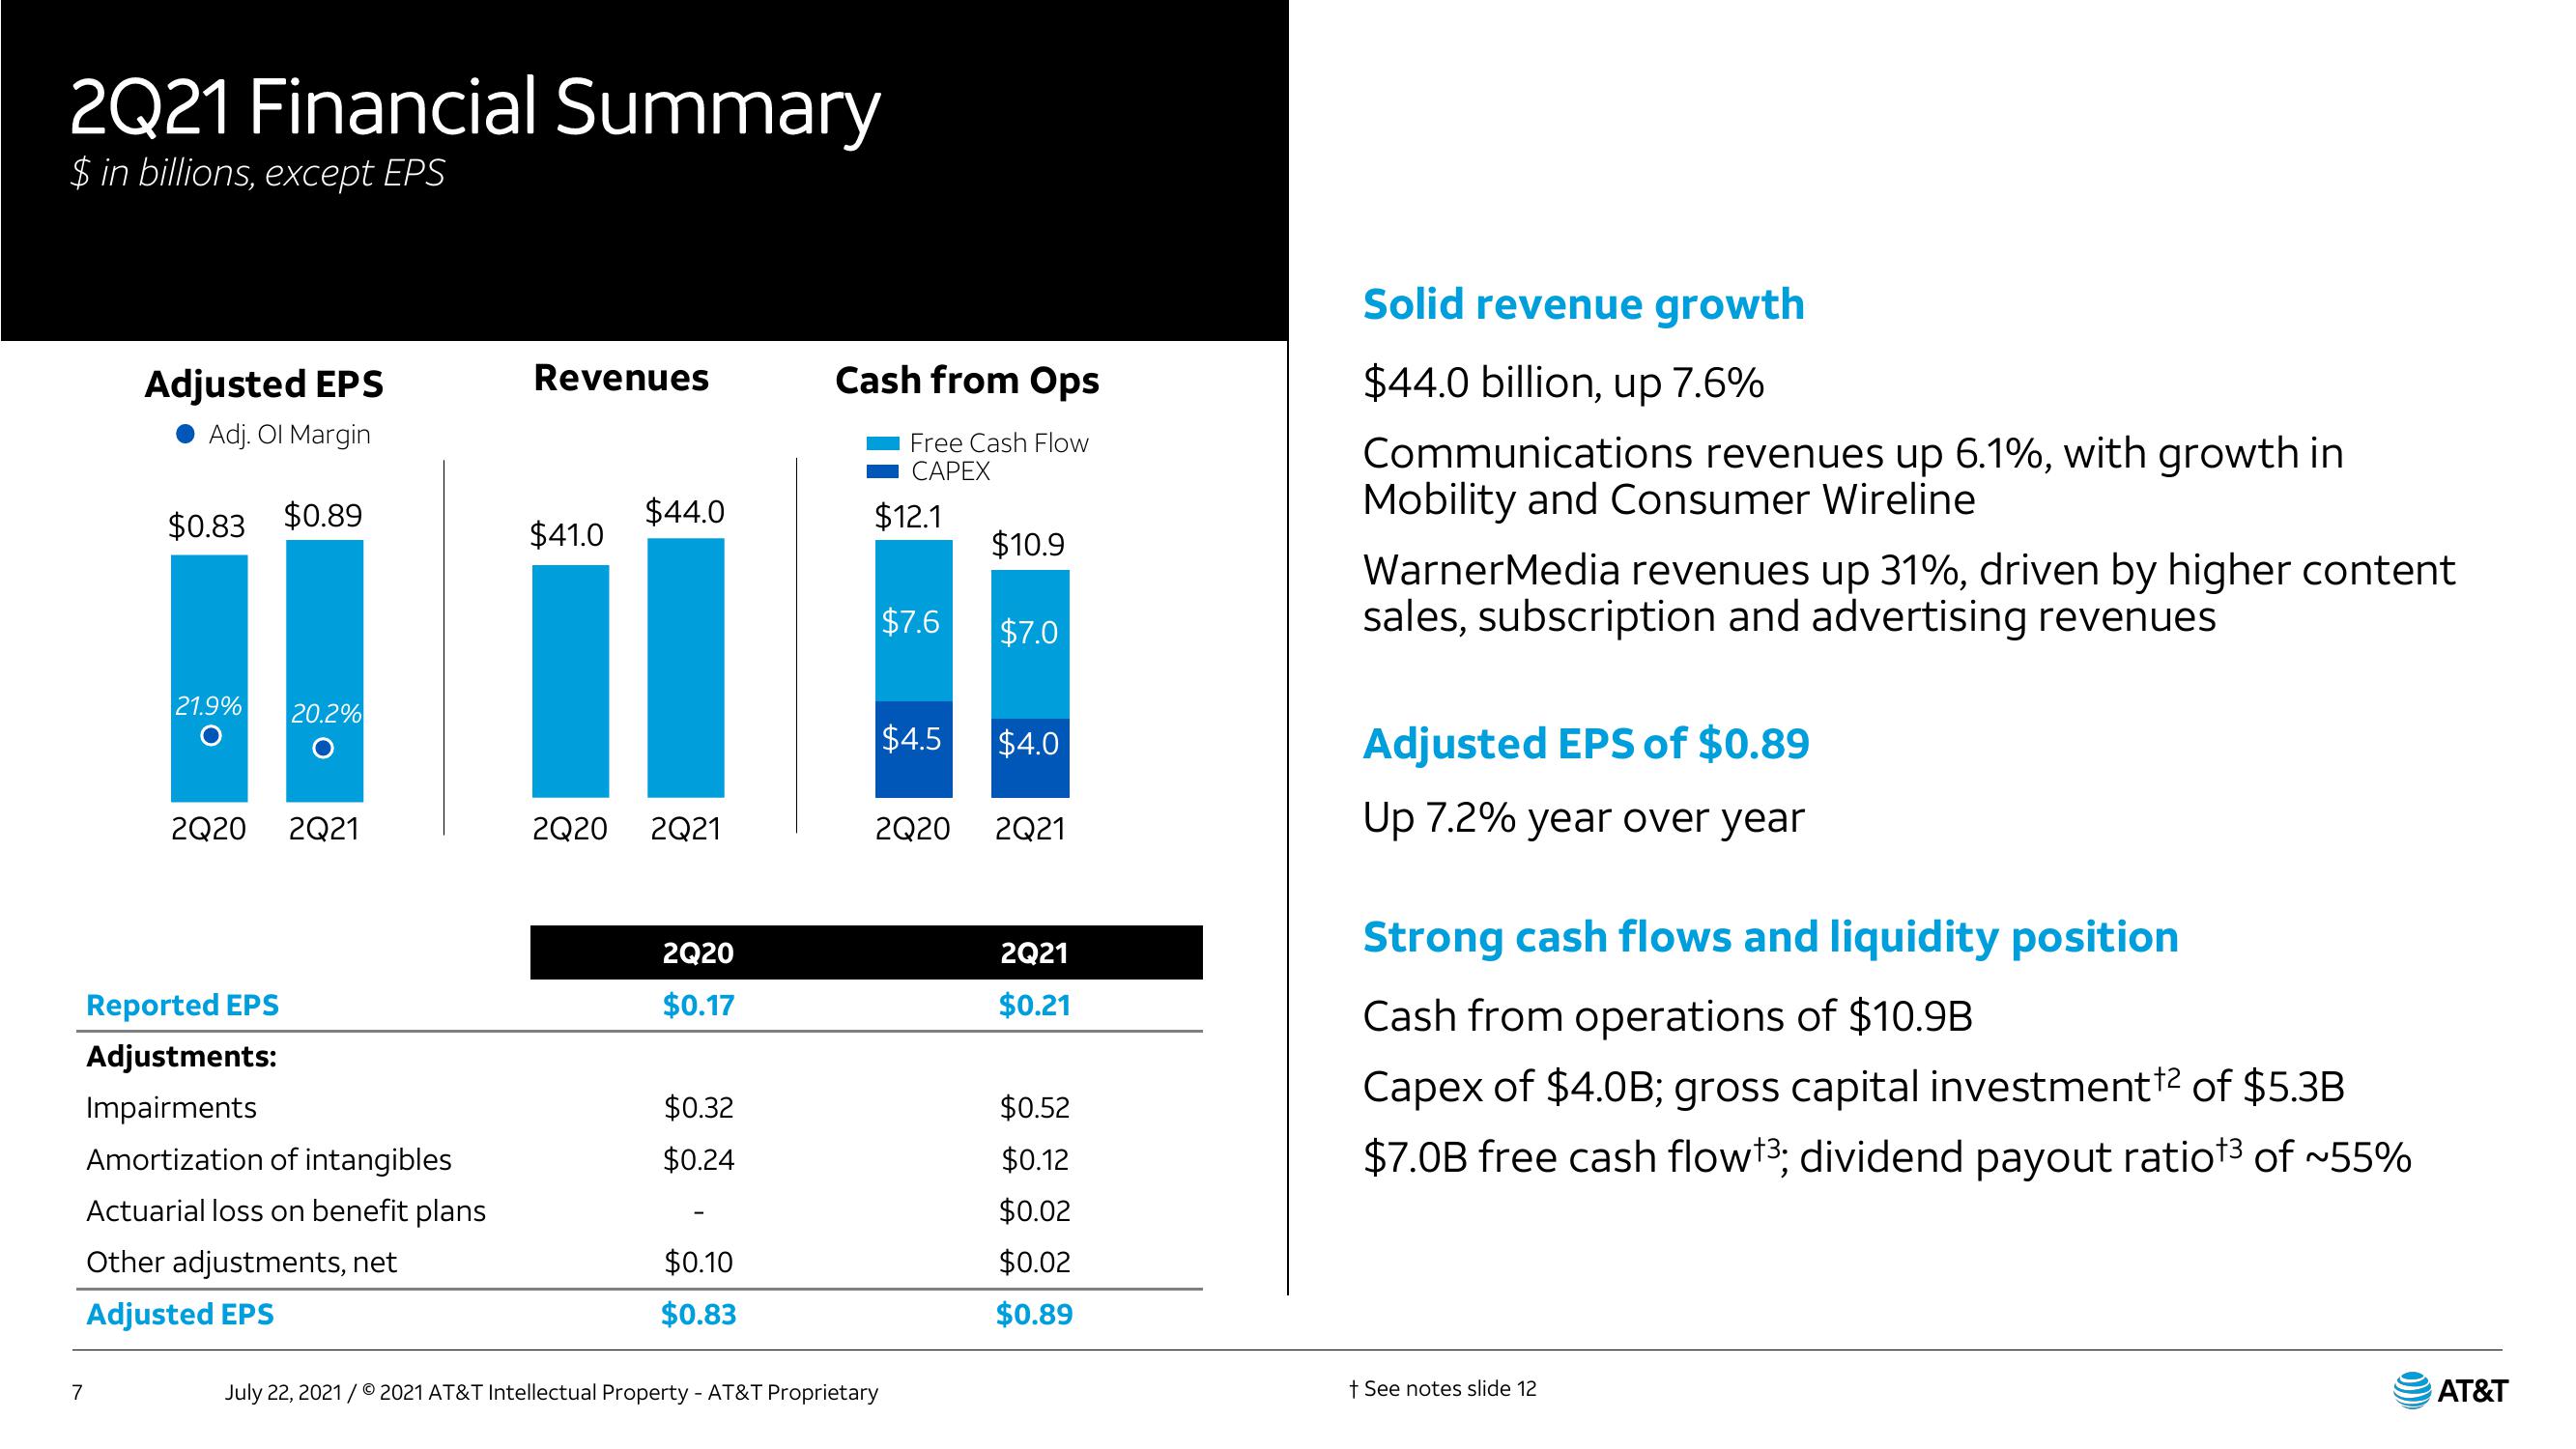
$44.0 billion, up 7.6%
Communications revenues up 6.1%, with growth in
Mobility and Consumer Wireline
WarnerMedia revenues up 31%, driven by higher content
sales, subscription and advertising revenues
Adjusted EPS of $0.89
Up 7.2% year over year
Strong cash flows and liquidity position
Cash from operations of $10.9B
Capex of $4.0B; gross capital investment ¹² of $5.3B
$7.0B free cash flowt3; dividend payout ratio¹3 of ~55%
+ See notes slide 12
AT&TView entire presentation