Babylon Investor Day Presentation Deck
Operational Leverage and Increased Scale Underpins the
Route to Profitability
Revenue & Adj. EBITDA Margin (unaudited)(¹)
($m)
16
(950.2)%
$16
2019A
(184.4)%
$79
2020A
$323
(53.9)%
2021A
$1Bn+
(29.5)%
2022E
(2)
921 ppt
margin improvement in
3 years
Technology & SG&A costs as a % of revenue
(unaudited) (3)
285%
150%
135%
Q3-2020
137%
44%
92%
112%
Q4-2020
73%
253ppt
(4)
116%
39%
38%
Q1-2021 Q2-2021
Technology costs
79%
92%
57%
86%
65%
36%
21%
Q3-2021 Q4-2021
SG&A costs
Notes: (1) See appendix slide titled 'Adjusted EBITDA Reconciliation and Calculation of Adjusted EBITDA Margin' for additional detail. (2) 2022 full year projected revenue as of May 12, 2022, as reported in Babylon's first quarter 2022 earnings release, filed with the
SEC on Form 6-K on May 12, 2022. Babylon is not reaffirming its previously reported guidance or projections at this Capital Markets Day presentation. (3) Technology costs is Research & development expenses and Platform & application expenses. Technology
costs and SG&A costs as percentages of revenue have been calculated excluding the one-off $28.4m revenue from Q1 2021. (4) $28.4m of one-off upfront revenue recognition in connection with a software licensing arrangement in Q1 2021.
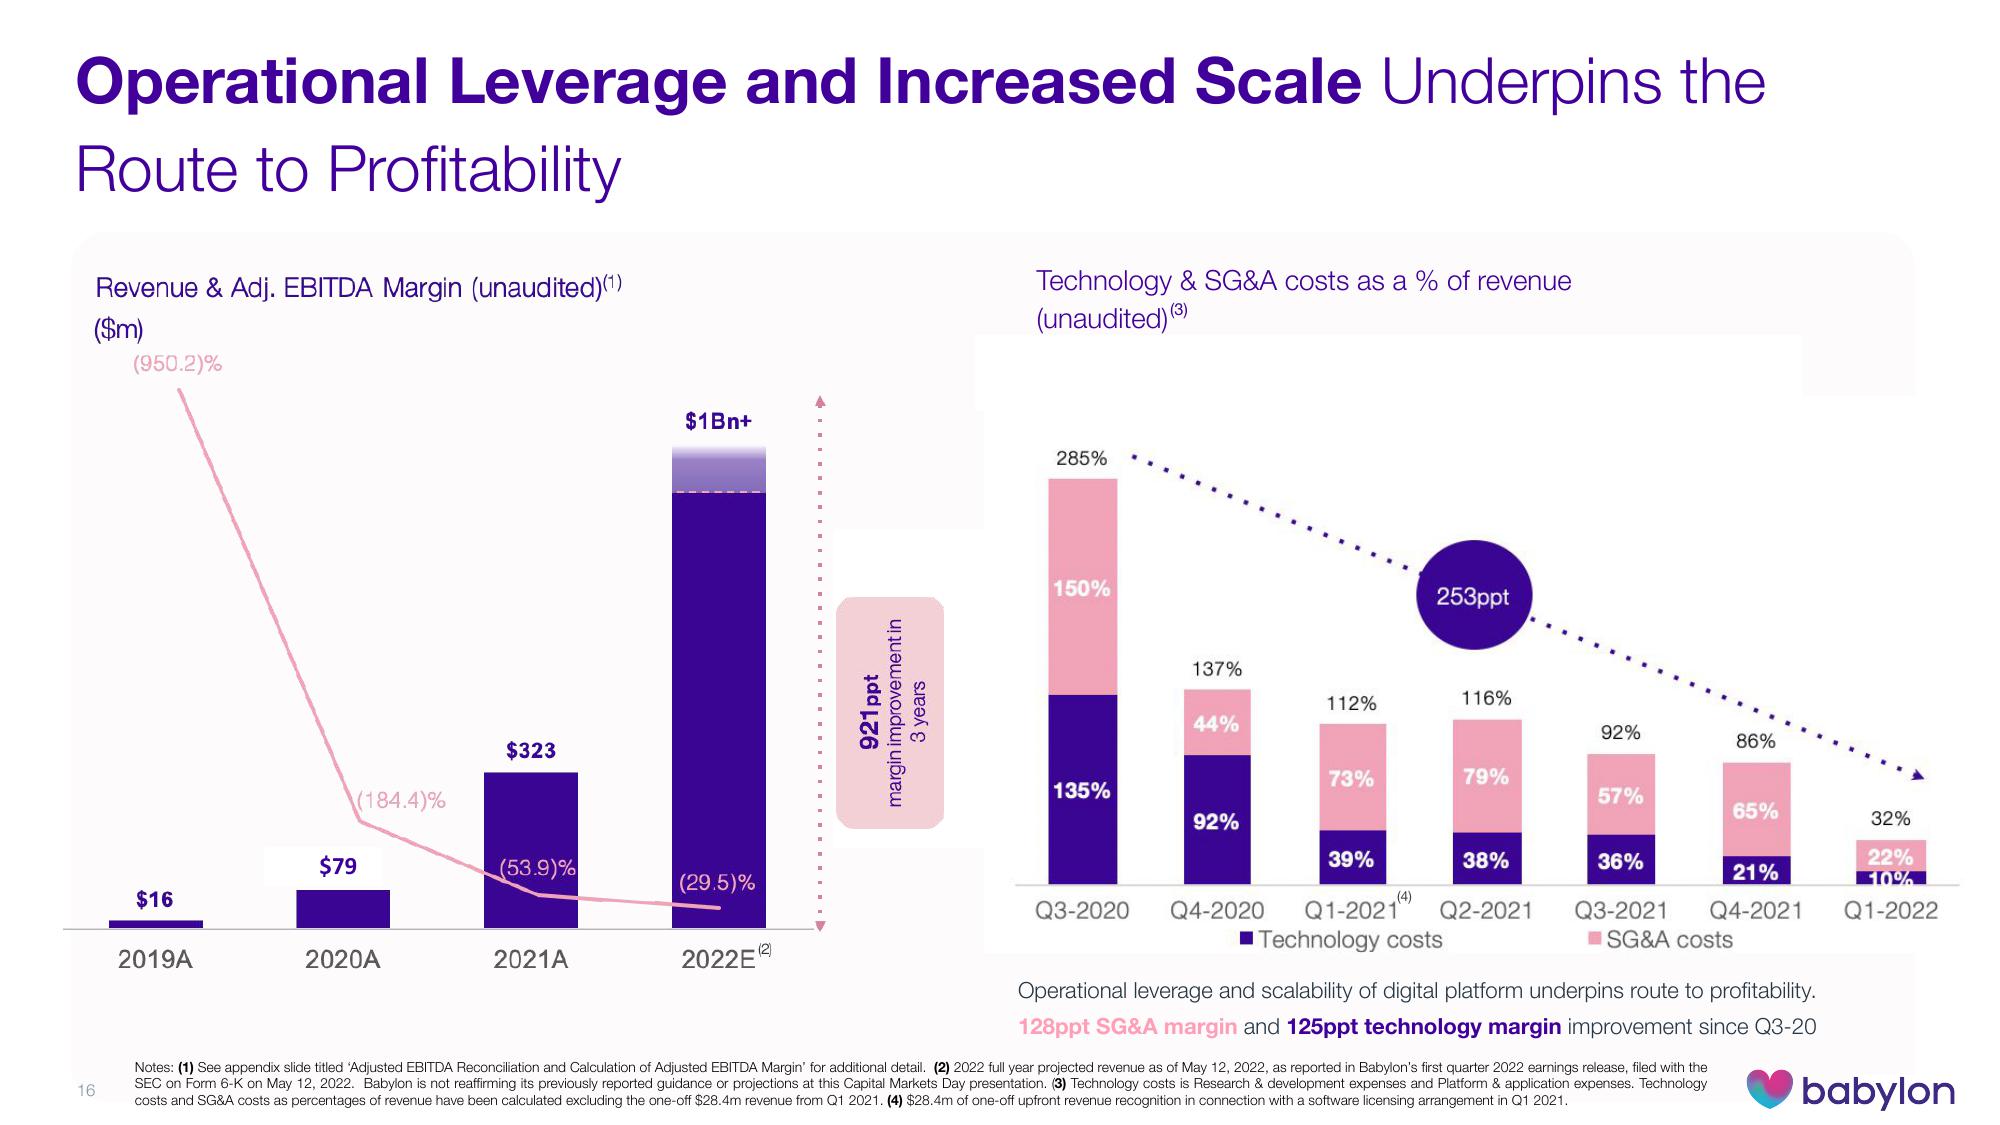
Operational leverage and scalability of digital platform underpins route to profitability.
128ppt SG&A margin and 125ppt technology margin improvement since Q3-20
32%
22%
10%
Q1-2022
babylonView entire presentation