Blackwells Capital Activist Presentation Deck
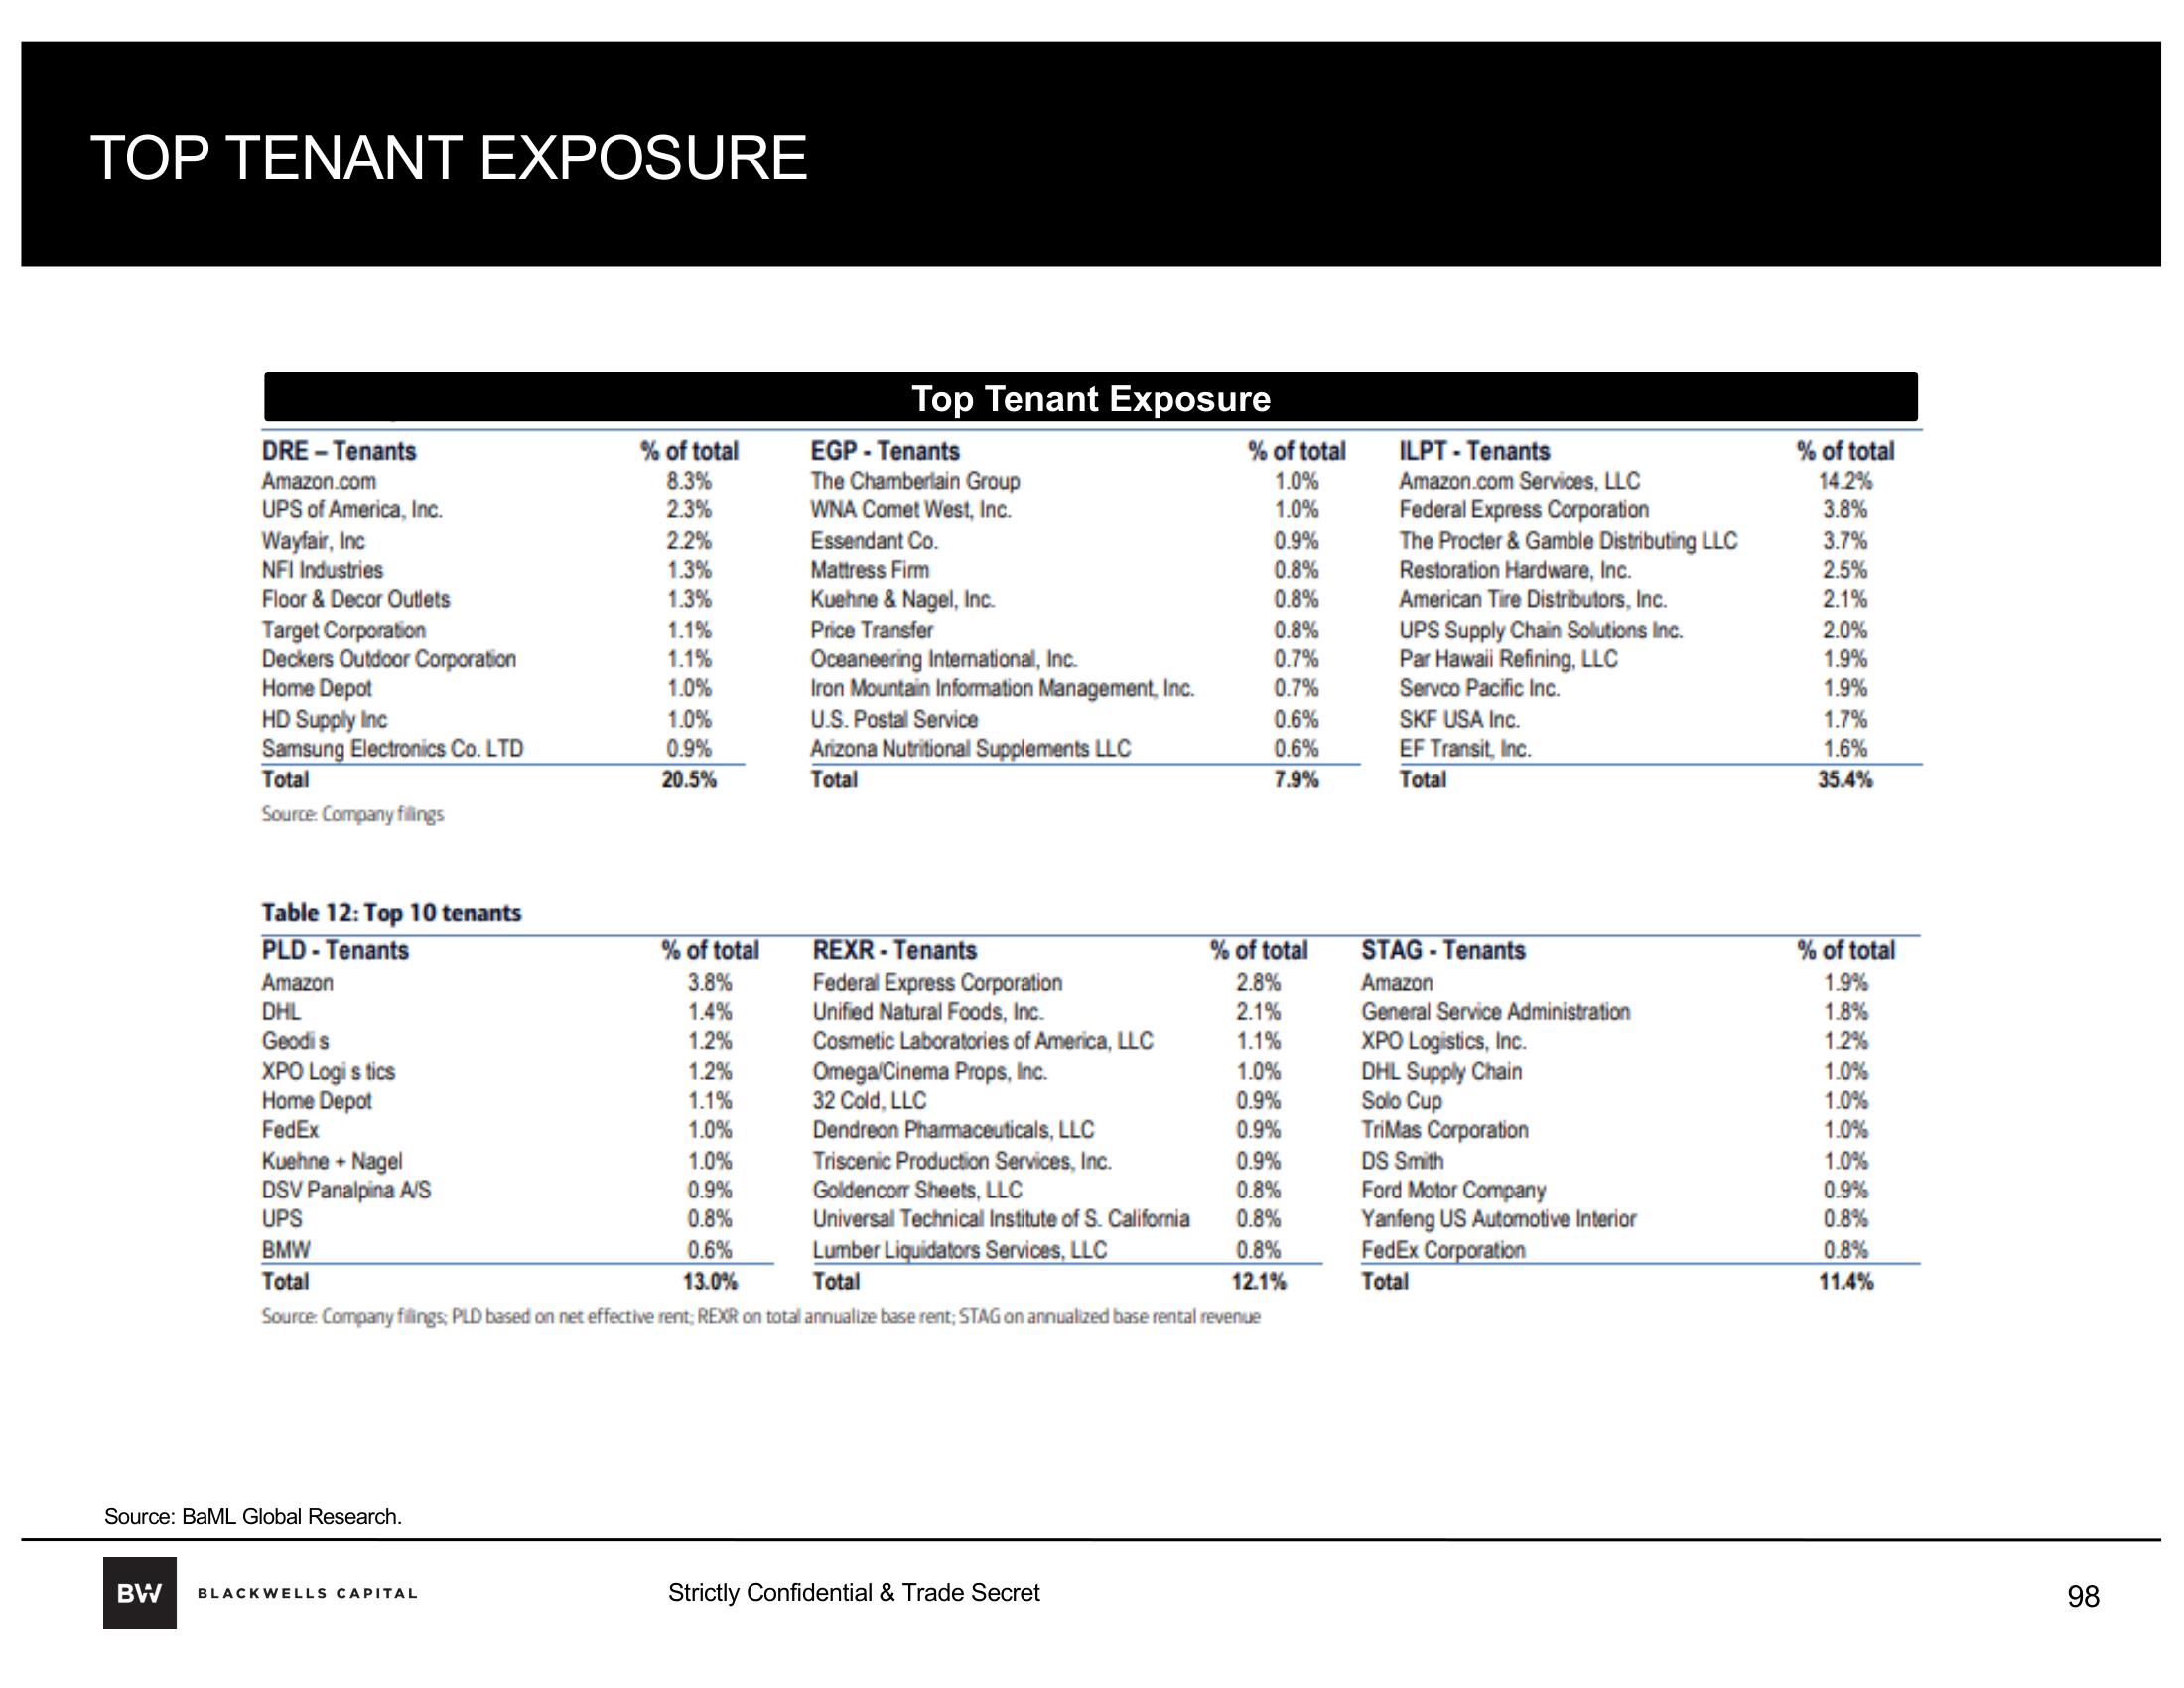
TOP TENANT EXPOSURE
DRE-Tenants
Amazon.com
UPS of America, Inc.
Wayfair, Inc
NFI Industries
Floor & Decor Outlets
Target Corporation
Deckers Outdoor Corporation
Home Depot
HD Supply Inc
Samsung Electronics Co. LTD
Total
Source: Company fillings
Table 12: Top 10 tenants
PLD - Tenants
Amazon
DHL
Geodis
XPO Logistics
Home Depot
FedEx
Kuehne + Nagel
DSV Panalpina A/S
UPS
BMW
Total
Source: BaML Global Research.
% of total
8.3%
2.3%
BW BLACKWELLS CAPITAL
2.2%
1.3%
1.3%
1.1%
1.1%
1.0%
1.0%
0.9%
20.5%
% of total
3.8%
1.4%
1.2%
1.2%
1.1%
1.0%
1.0%
0.9%
0.8%
0.6%
13.0%
Top Tenant Exposure
EGP - Tenants
The Chamberlain Group
WNA Comet West, Inc.
Essendant Co.
Mattress Firm
Kuehne & Nagel, Inc.
Price Transfer
Oceaneering International, Inc.
Iron Mountain Information Management, Inc.
U.S. Postal Service
Arizona Nutritional Supplements LLC
Total
REXR- Tenants
Federal Express Corporation
Unified Natural Foods, Inc.
Cosmetic Laboratories of America, LLC
Omega/Cinema Props, Inc.
32 Cold, LLC
Dendreon Pharmaceuticals, LLC
Triscenic Production Services, Inc.
Goldencom Sheets, LLC
Universal Technical Institute of S. California
% of total
1.0%
1.0%
Strictly Confidential & Trade Secret
Lumber Liquidators Services, LLC
Total
Source: Company fillings; PLD based on net effective rent; REXR on total annualize base rent; STAG on annualized base rental revenue
0.9%
0.8%
0.8%
0.8%
0.7%
0.7%
0.6%
0.6%
7.9%
% of total
2.8%
2.1%
1.1%
1.0%
0.9%
0.9%
0.9%
0.8%
0.8%
0.8%
12.1%
ILPT - Tenants
Amazon.com Services, LLC
Federal Express Corporation
The Procter & Gamble Distributing LLC
Restoration Hardware, Inc.
American Tire Distributors, Inc.
UPS Supply Chain Solutions Inc.
Par Hawaii Refining, LLC
Servco Pacific Inc.
SKF USA Inc.
EF Transit, Inc.
Total
STAG - Tenants
Amazon
General Service Administration
XPO Logistics, Inc.
DHL Supply Chain
Solo Cup
TriMas Corporation
DS Smith
Ford Motor Company
Yanfeng US Automotive Interior
FedEx Corporation
Total
% of total
14.2%
3.8%
3.7%
2.5%
2.1%
2.0%
1.9%
1.9%
1.7%
1.6%
35.4%
% of total
1.9%
1.8%
1.2%
1.0%
1.0%
1.0%
1.0%
0.9%
0.8%
0.8%
11.4%
98View entire presentation