Jefferies Financial Group Investor Presentation Deck
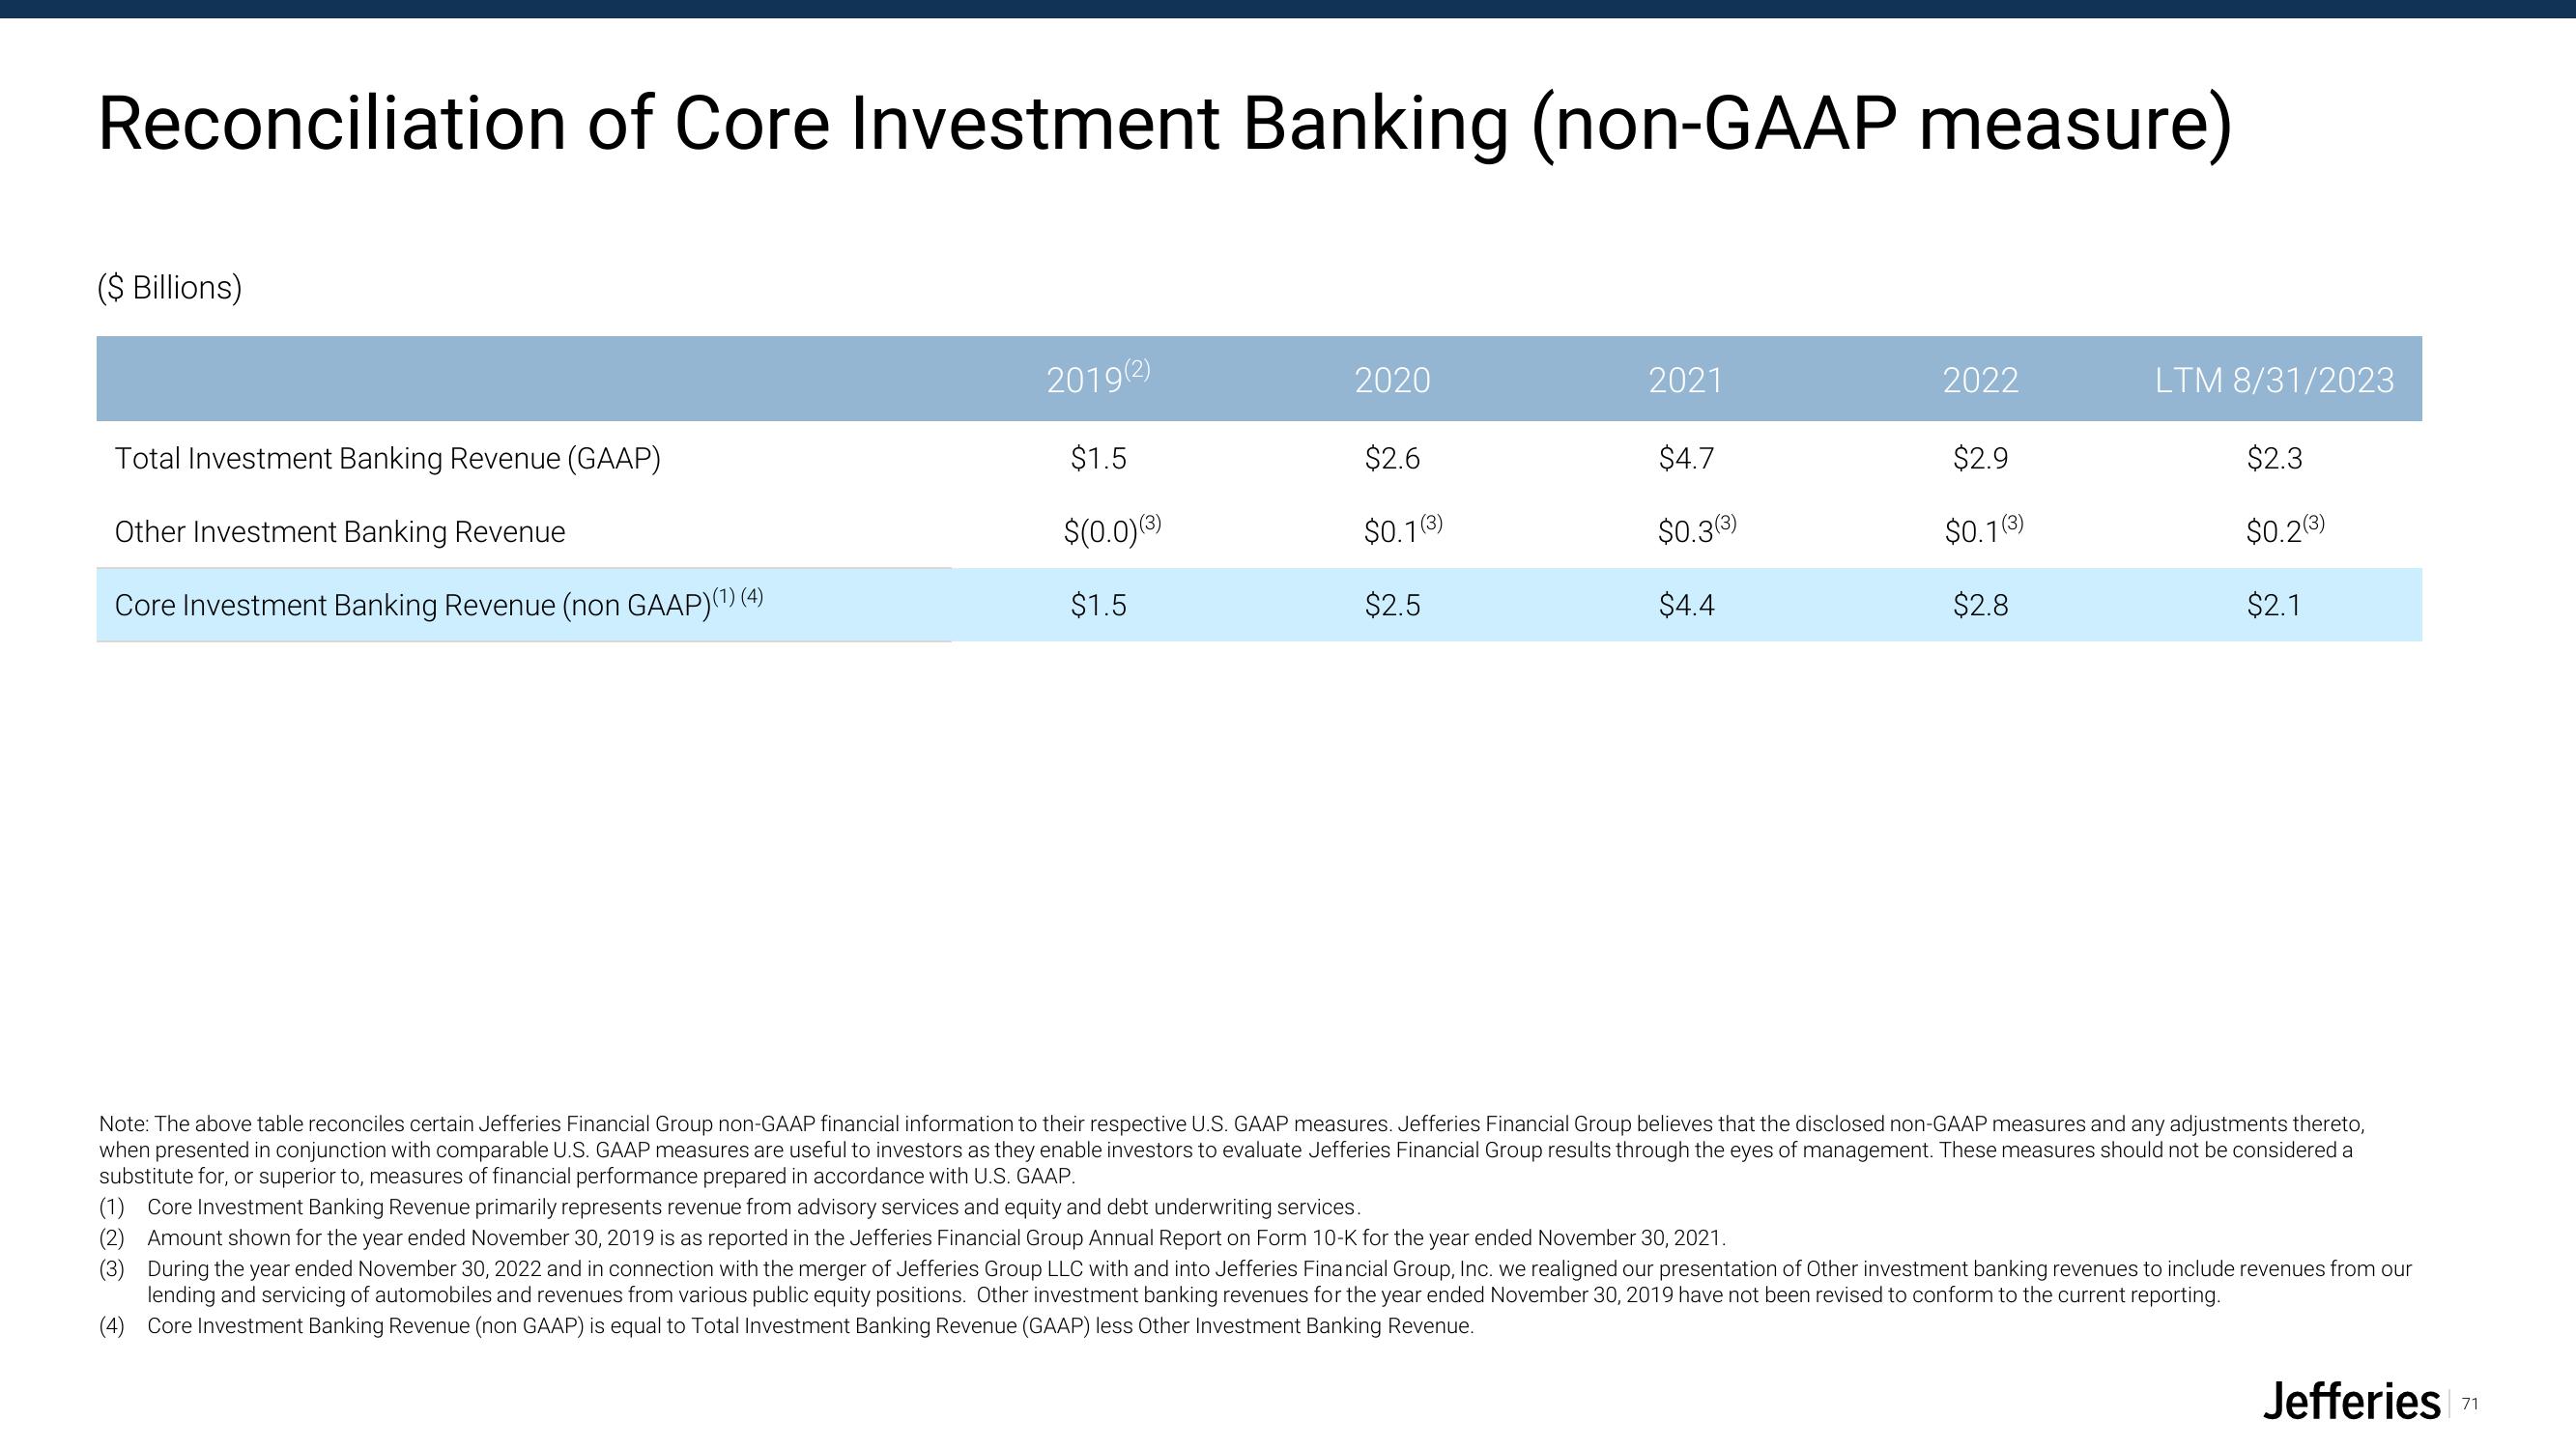
Reconciliation of Core Investment Banking (non-GAAP measure)
($ Billions)
Total Investment Banking Revenue (GAAP)
Other Investment Banking Revenue
Core Investment Banking Revenue (non GAAP)(¹) (4)
EN
2019(2)
$1.5
$(0.0) (3)
$1.5
(3)
2020
$2.6
$0.1(3)
$2.5
2021
$4.7
$0.3(3)
$4.4
2022
$2.9
$0.1(3)
$2.8
LTM 8/31/2023
Note: The above table reconciles certain Jefferies Financial Group non-GAAP financial information to their respective U.S. GAAP measures. Jefferies Financial Group believes that the disclosed non-GAAP measures and any adjustments thereto,
when presented in conjunction with comparable U.S. GAAP measures are useful to investors as they enable investors to evaluate Jefferies Financial Group results through the eyes of management. These measures should not be considered a
substitute for, or superior to, measures of financial performance prepared in accordance with U.S. GAAP.
$2.3
$0.2(3)
$2.1
(1) Core Investment Banking Revenue primarily represents revenue from advisory services and equity and debt underwriting services.
Amount shown for the year ended November 30, 2019 is as reported in the Jefferies Financial Group Annual Report on Form 10-K for the year ended November 30, 2021.
During the year ended November 30, 2022 and in connection with the merger of Jefferies Group LLC with and into Jefferies Financial Group, Inc. we realigned our presentation of Other investment banking revenues to include revenues from our
lending and servicing of automobiles and revenues from various public equity positions. Other investment banking revenues for the year ended November 30, 2019 have not been revised to conform to the current reporting.
(4) Core Investment Banking Revenue (non GAAP) is equal to Total Investment Banking Revenue (GAAP) less Other Investment Banking Revenue.
Jefferies
71View entire presentation