Cerberus Global NPL Fund, L.P.
2 Attractive Cash Flow Profile: Rapid Cost Recovery
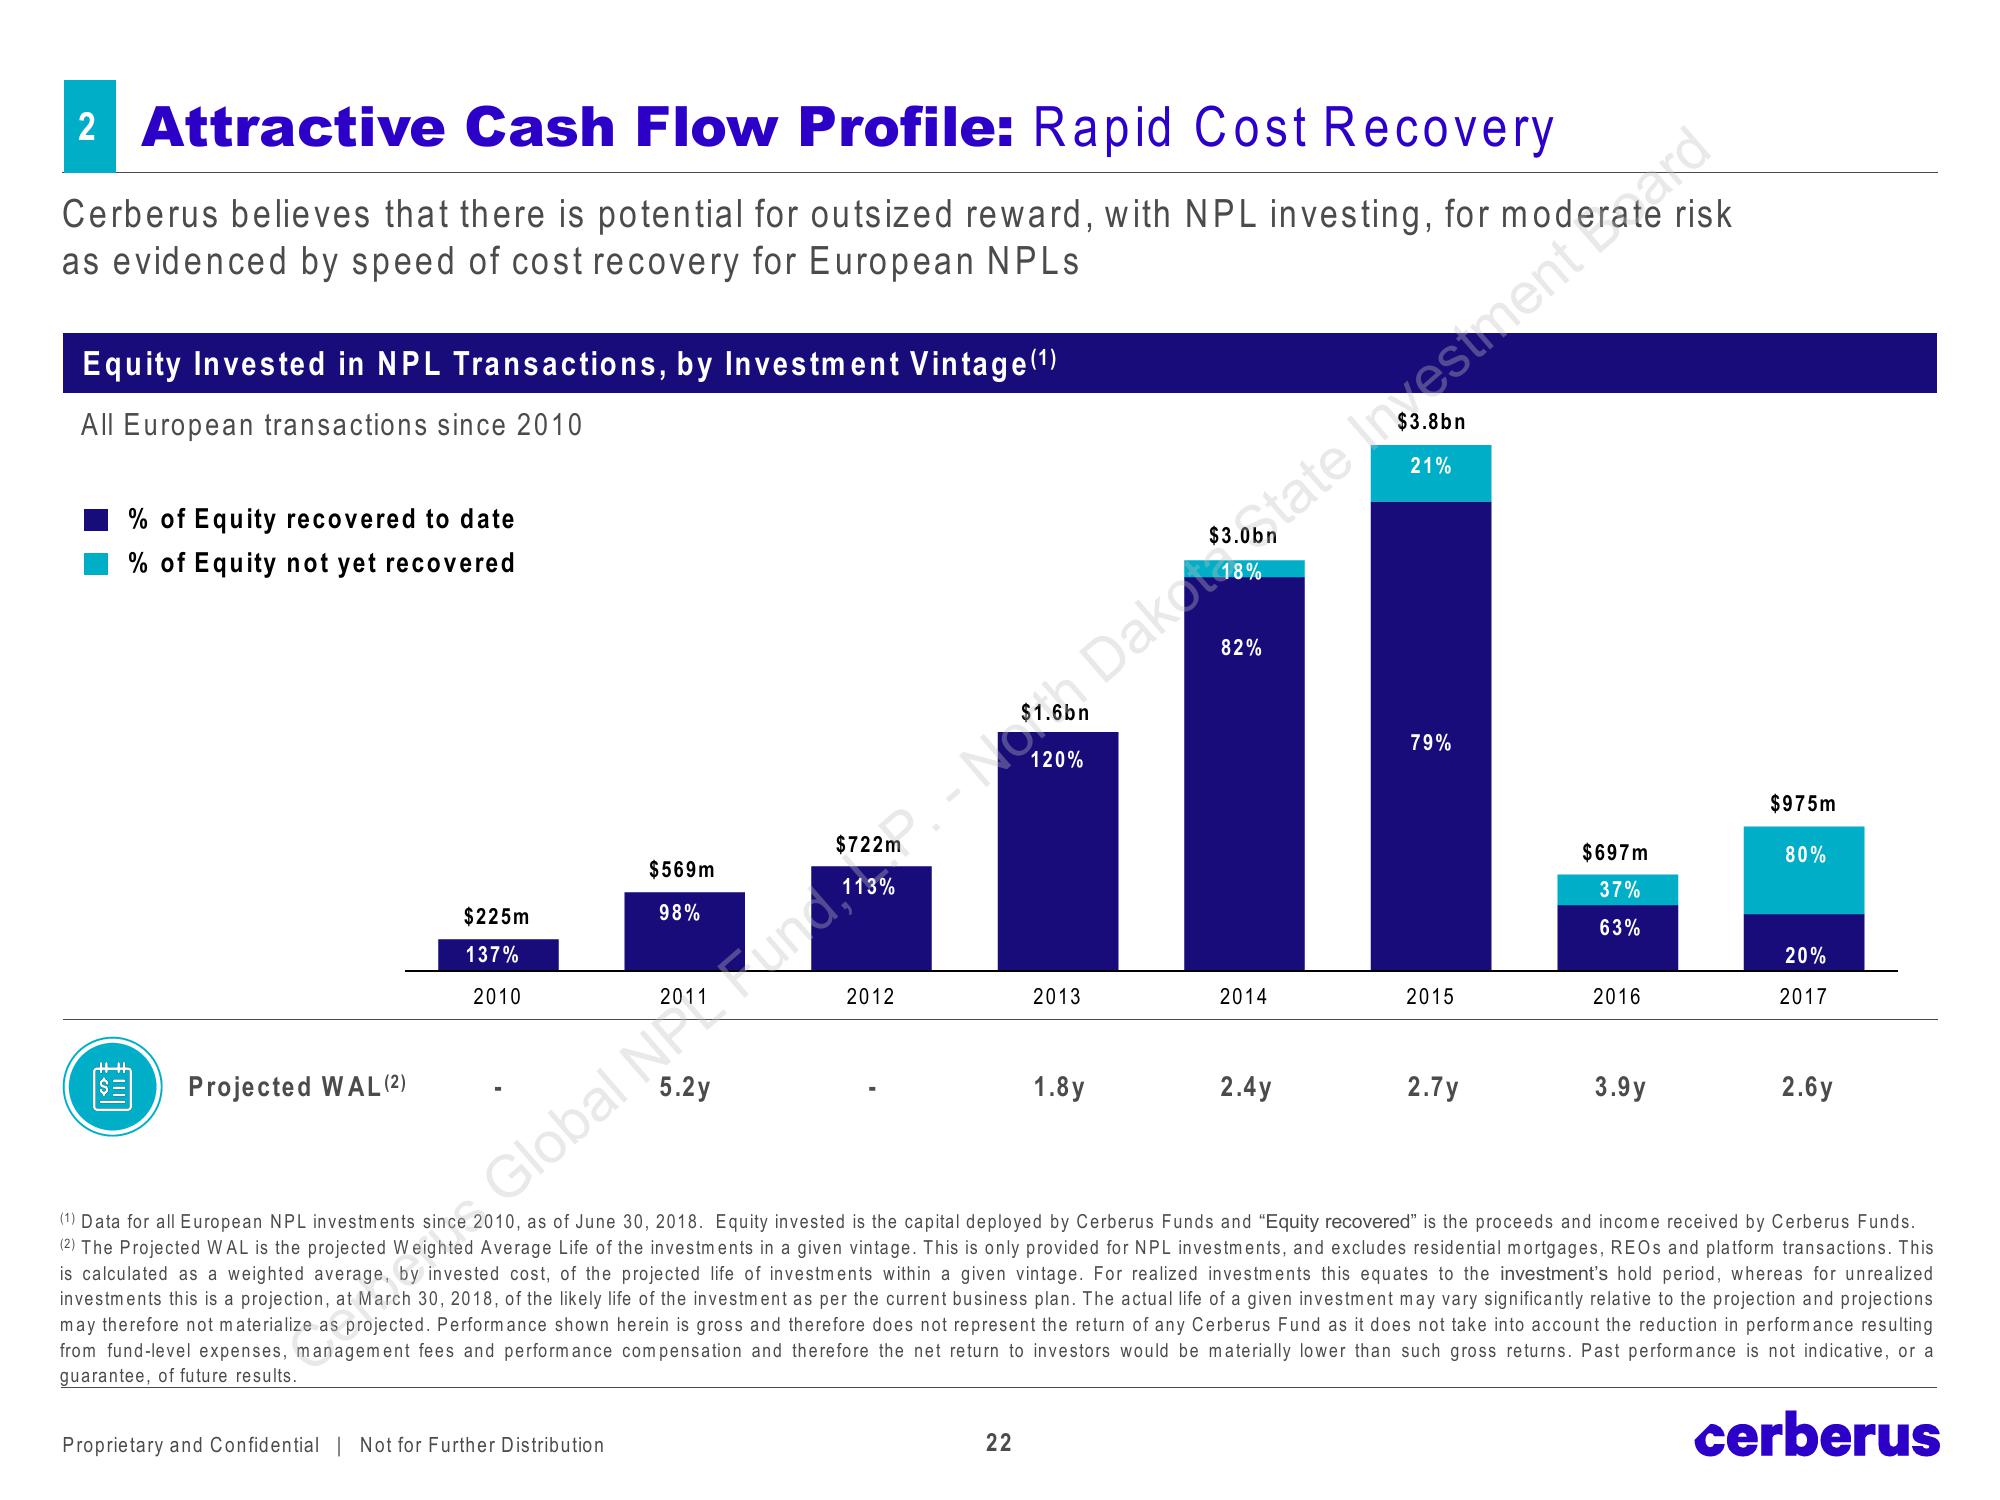
Cerberus believes that there is potential for outsized reward, with NPL investing, for
as evidenced by speed of cost recovery for European NPLs
Equity Invested in NPL Transactions, by Investment Vintage (¹)
All European transactions since 2010
% of Equity recovered to date
% of Equity not yet recovered
€!!
Projected WAL (2)
$225m
137%
2010
$569m
98%
5.2y
Proprietary and Confidential | Not for Further Distribution
2012
2013
1.8y
22
82%
2014
2.4y
21%
79%
2015
2.7y
$697m
37%
63%
2016
3.9y
risk
$975m
80%
20%
2017
Global Nound 2.- No Dakot, tate in sestment feraxd
2.6y
(1) Data for all European NPL investments since 2010, as of June 30, 2018. Equity invested is the capital deployed by Cerberus Funds and "Equity recovered" is the proceeds and income received by Cerberus Funds.
(2) The Projected WAL is the projected Weighted Average Life of the investments in a given vintage. This is only provided for NPL investments, and excludes residential mortgages, REOs and platform transactions. This
is calculated as a weighted average, by invested cost, of the projected life of investments within a given vintage. For realized investments this equates to the investment's hold period, whereas for unrealized
investments this is a projection, at March 30, 2018, of the likely life of the investment as per the current business plan. The actual life of a given investment may vary significantly relative to the projection and projections
may therefore not materialize as projected. Performance shown herein is gross and therefore does not represent the return of any Cerberus Fund as it does not take into account the reduction in performance resulting
from fund-level expenses, management fees and performance compensation and therefore the net return to investors would be materially lower than such gross returns. Past performance is not indicative, or a
guarantee, of future results.
cerberusView entire presentation