Origo Results Presentation Deck
B
Revenue
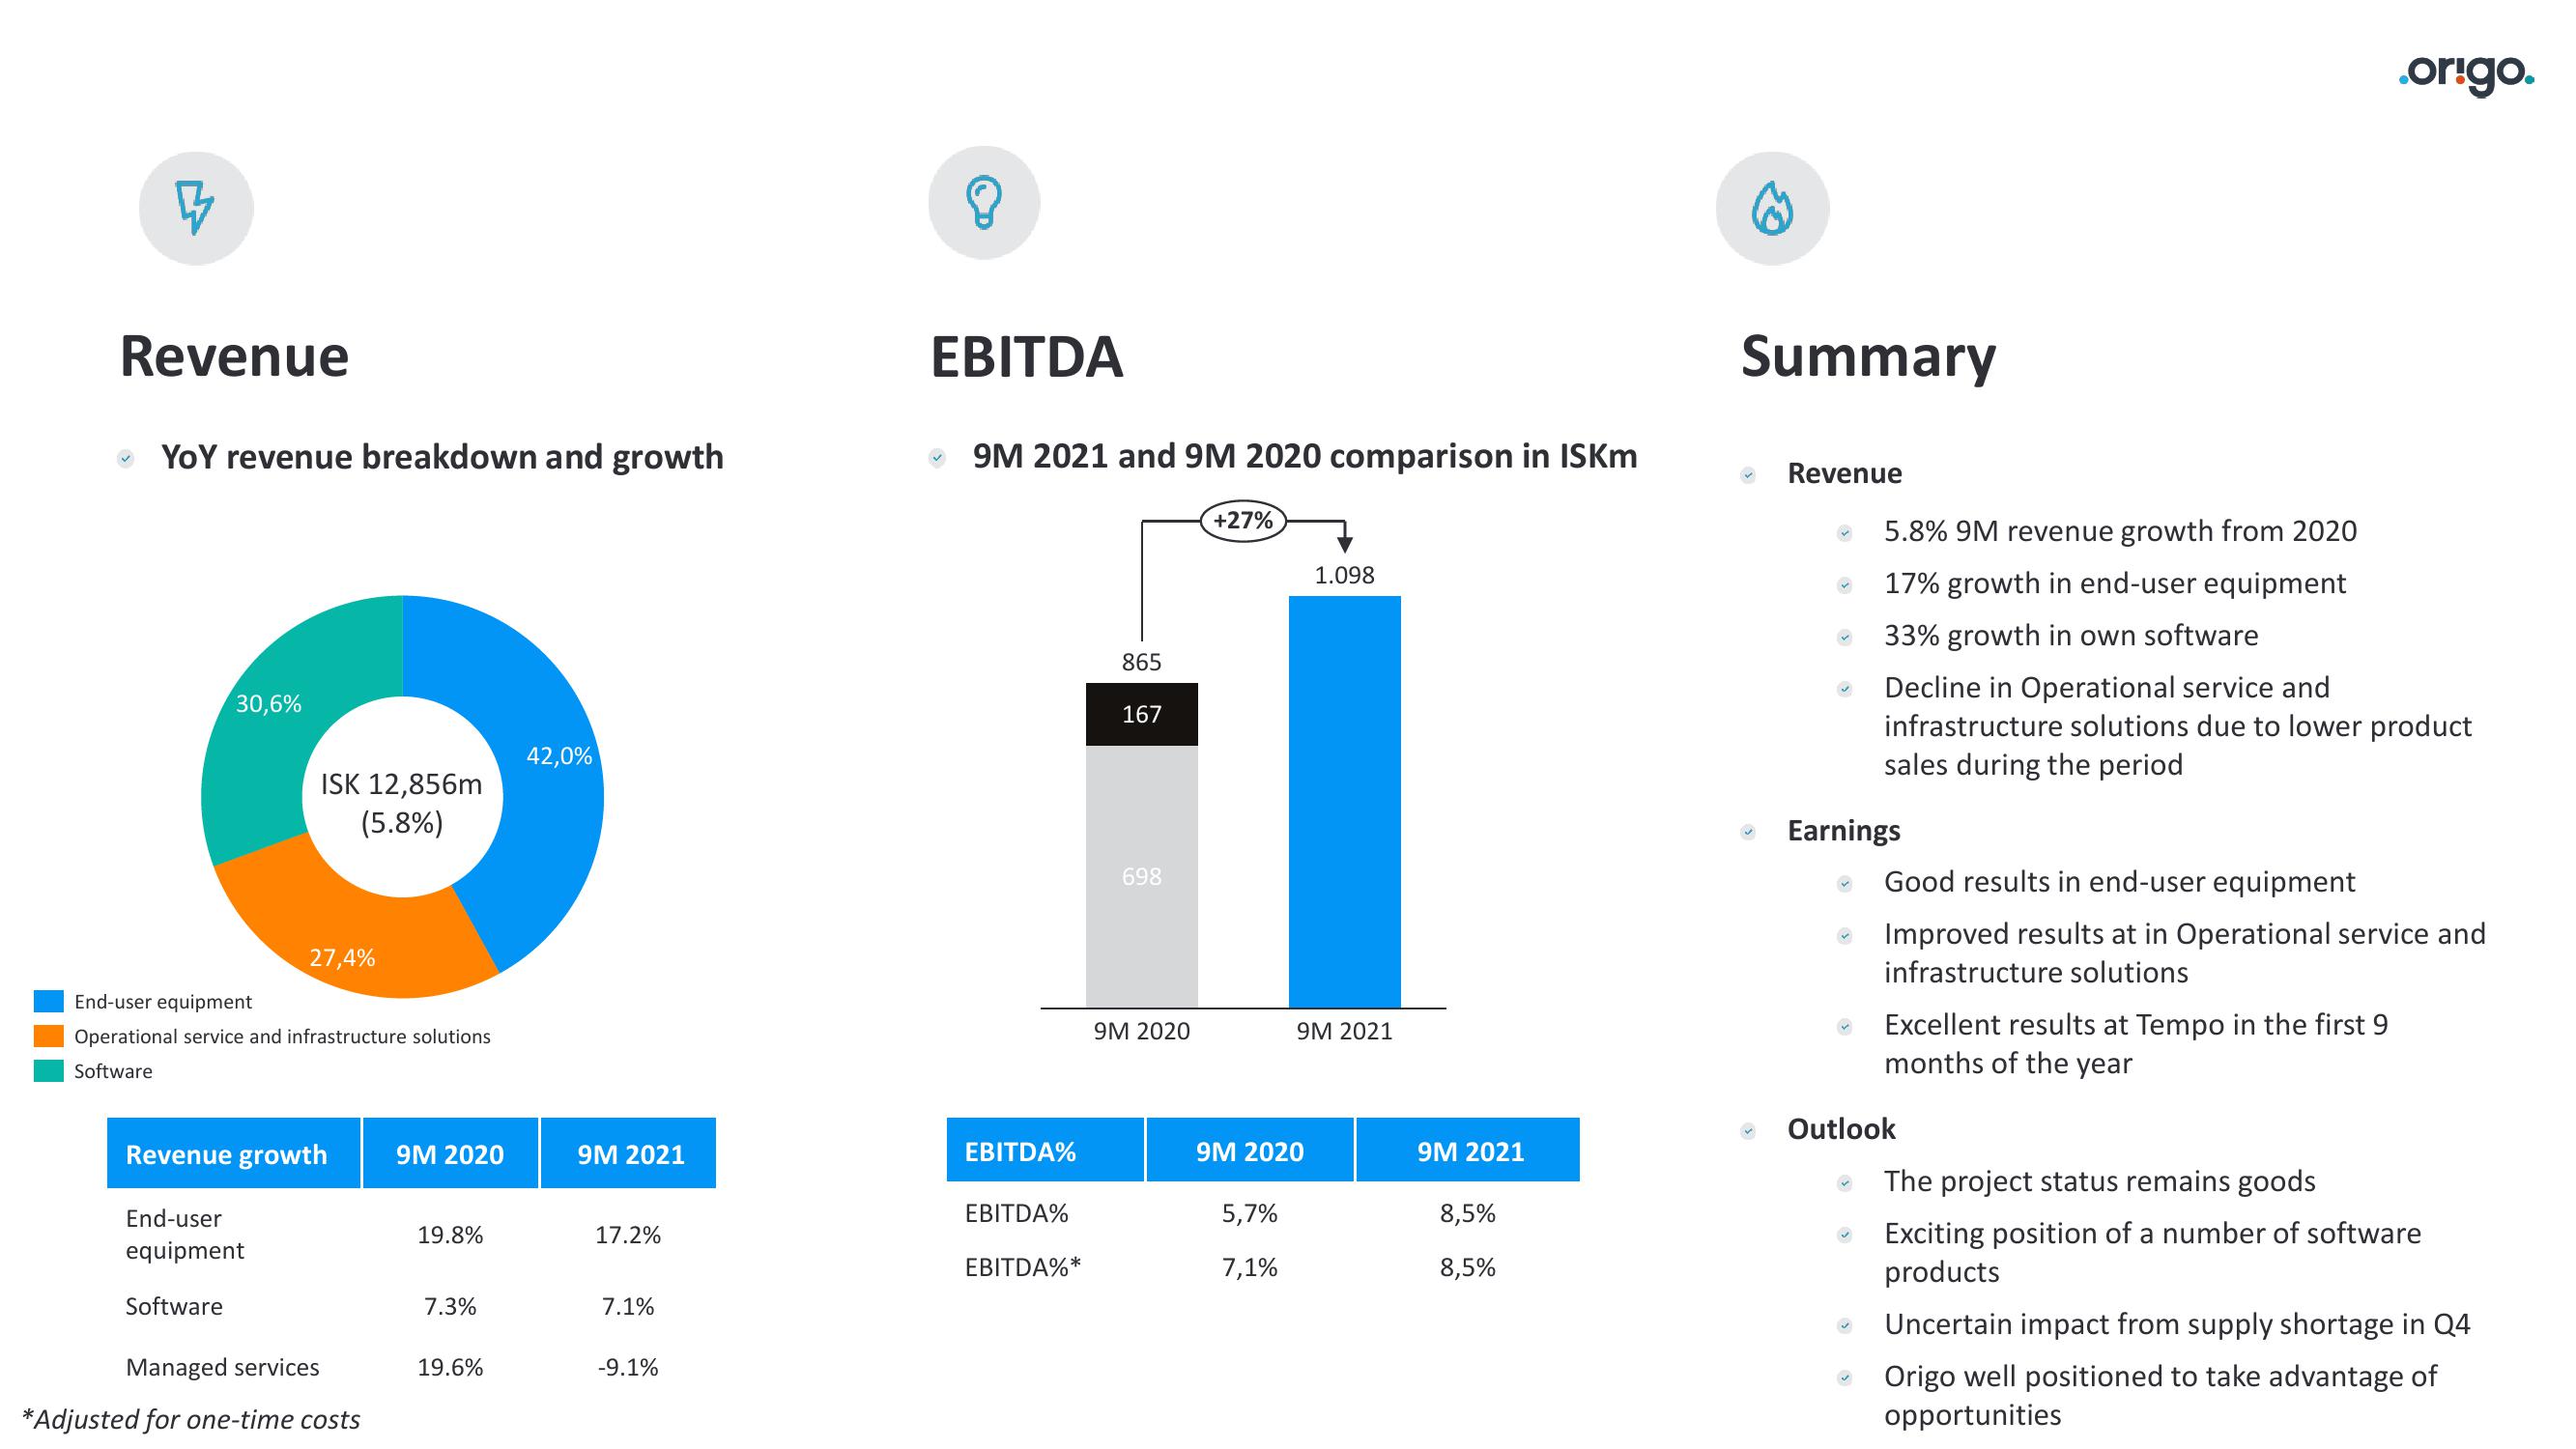
YOY revenue breakdown and growth
30,6%
ISK 12,856m
(5.8%)
End-user equipment
Operational service and infrastructure solutions
Software
End-user
equipment
Software
27,4%
Revenue growth 9M 2020
Managed services
*Adjusted for one-time costs
19.8%
7.3%
19.6%
42,0%
9M 2021
17.2%
7.1%
-9.1%
EBITDA
9M 2021 and 9M 2020 comparison in ISKm
EBITDA%
EBITDA%
EBITDA%*
865
167
698
9M 2020
+27%
9M 2020
5,7%
7,1%
1.098
9M 2021
9M 2021
8,5%
8,5%
Summary
Revenue
5.8% 9M revenue growth from 2020
17% growth in end-user equipment
33% growth in own software
Decline in Operational service and
infrastructure solutions due to lower product
sales during the period
Earnings
.origo.
Good results in end-user equipment
Improved results at in Operational service and
infrastructure solutions
Excellent results at Tempo in the first 9
months of the year
Outlook
The project status remains goods
Exciting position of a number of software
products
Uncertain impact from supply shortage in Q4
Origo well positioned to take advantage of
opportunitiesView entire presentation