Hilltop Holdings Results Presentation Deck
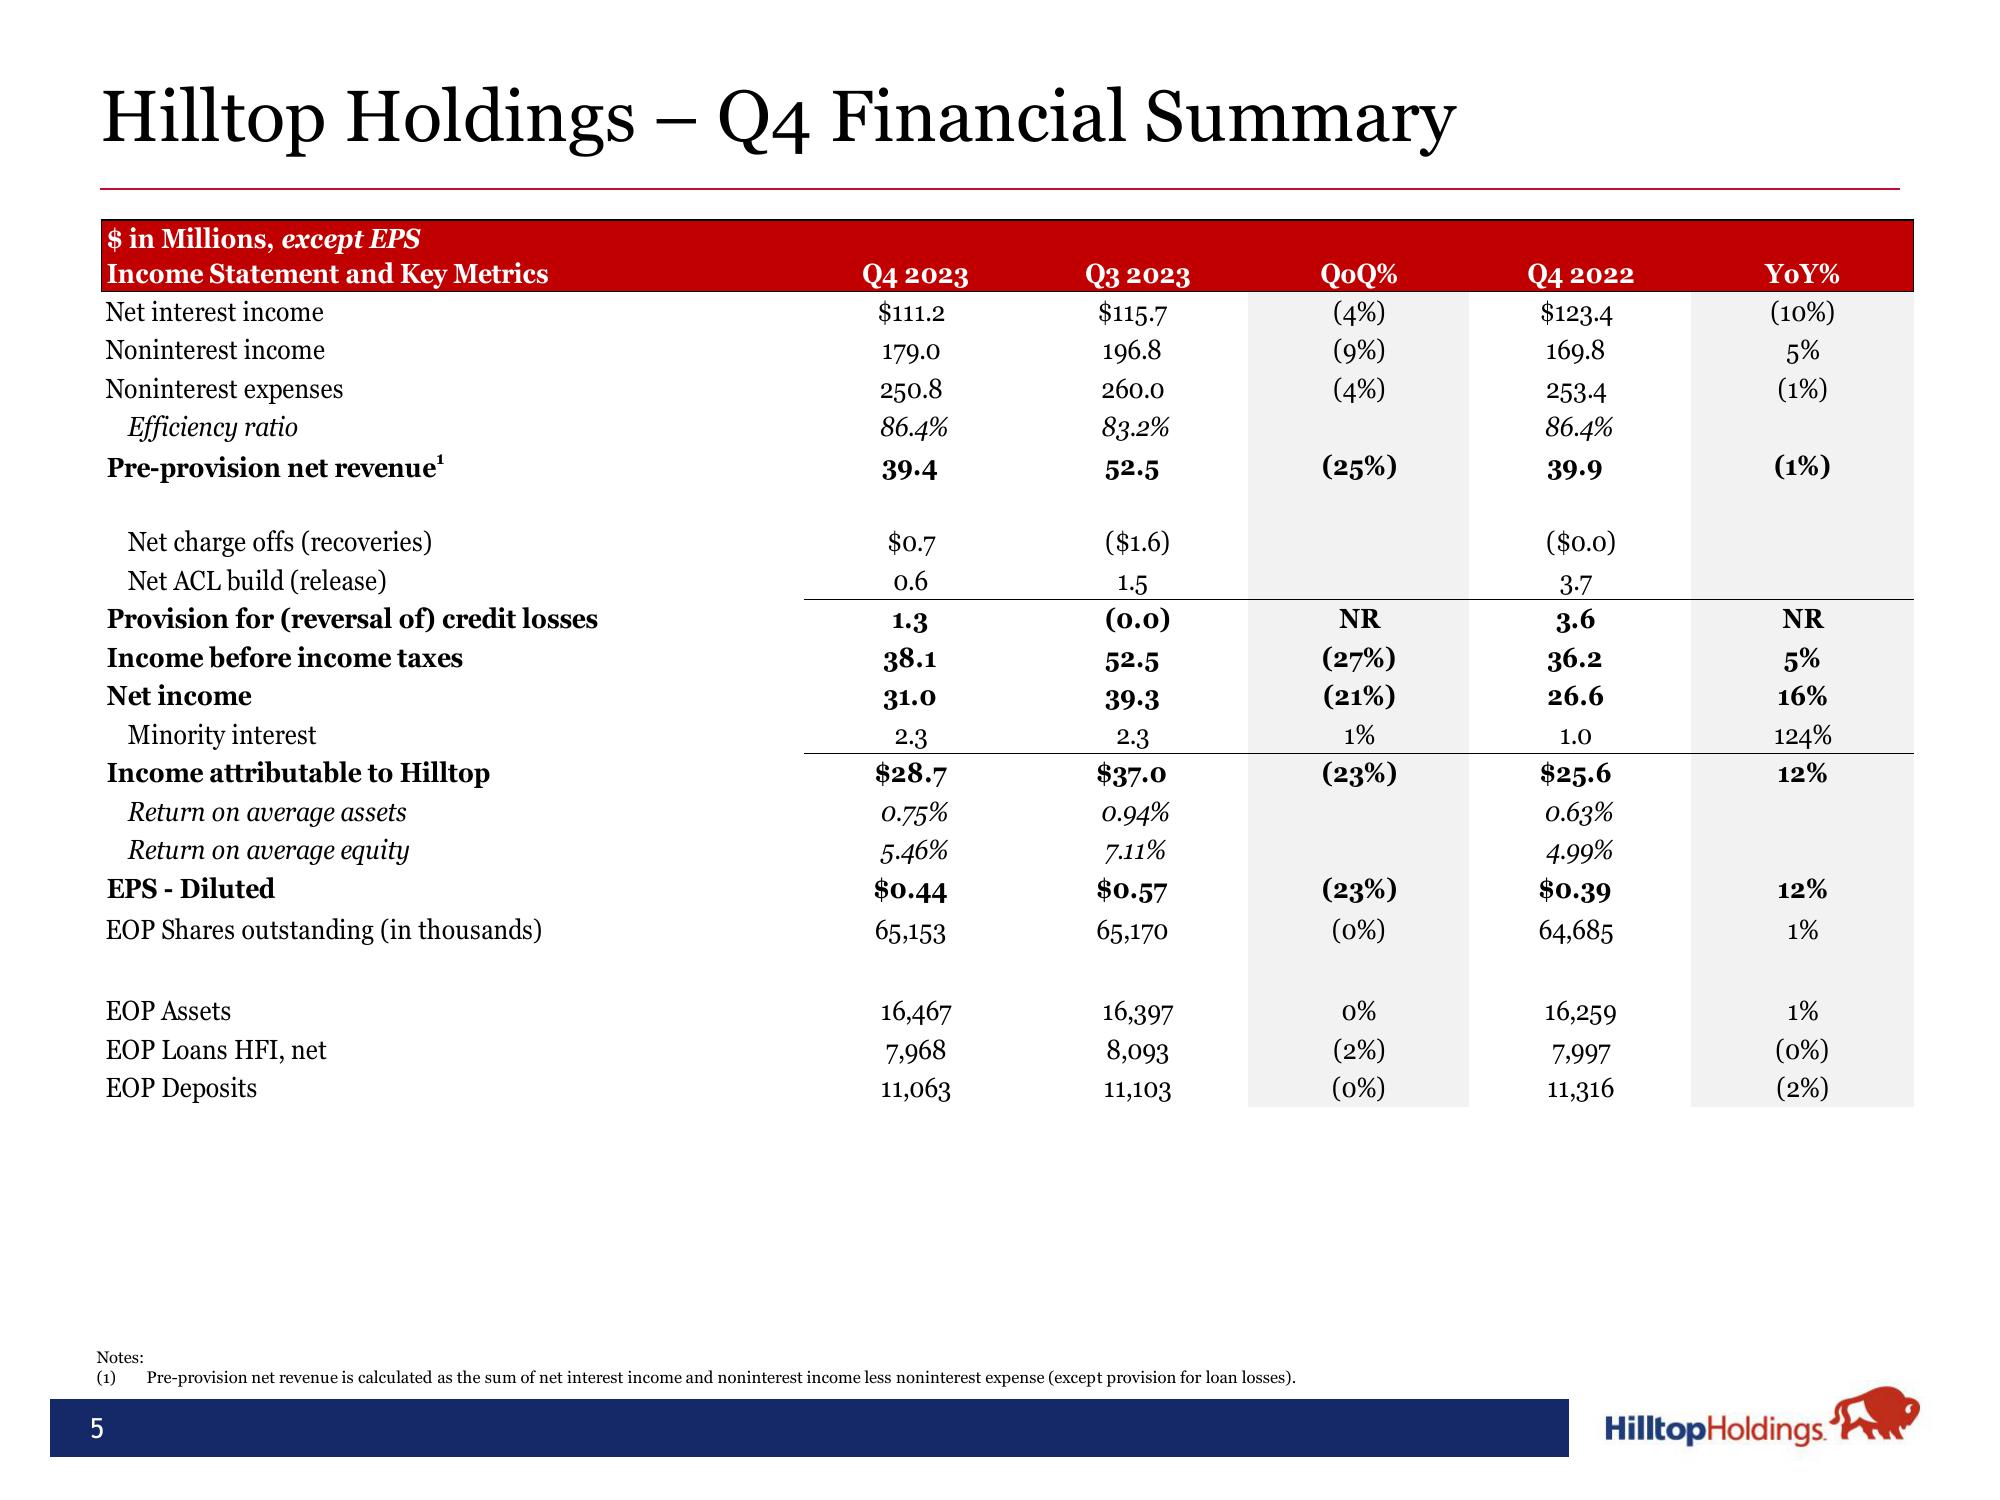
Hilltop Holdings - Q4 Financial Summary
$ in Millions, except EPS
Income Statement and Key Metrics
Net interest income
Noninterest income
Noninterest expenses
Efficiency ratio
Pre-provision net revenue¹
Net charge offs (recoveries)
Net ACL build (release)
Provision for (reversal of) credit losses
Income before income taxes
Net income
Minority interest
Income attributable to Hilltop
Return on average assets
Return on average equity
EPS - Diluted
EOP Shares outstanding (in thousands)
EOP Assets
EOP Loans HFI, net
EOP Deposits
Q4 2023
$111.2
179.0
250.8
86.4%
39.4
5
$0.7
0.6
1.3
38.1
31.0
2.3
$28.7
0.75%
5.46%
$0.44
65,153
16,467
7,968
11,063
Q3 2023
$115.7
196.8
260.0
83.2%
52.5
($1.6)
1.5
(0.0)
52.5
39.3
2.3
$37.0
0.94%
7.11%
$0.57
65,170
16,397
8,093
11,103
Notes:
(1) Pre-provision net revenue is calculated as the sum of net interest income and noninterest income less noninterest expense (except provision for loan losses).
QoQ%
(4%)
(9%)
(4%)
(25%)
NR
(27%)
(21%)
1%
(23%)
(23%)
(0%)
0%
(2%)
(0%)
Q4 2022
$123.4
169.8
253.4
86.4%
39.9
($0.0)
3.7
3.6
36.2
26.6
1.0
$25.6
0.63%
4.99%
$0.39
64,685
16,259
7,997
11,316
YOY%
(10%)
5%
(1%)
(1%)
NR
5%
16%
124%
12%
12%
1%
1%
(0%)
(2%)
Hilltop Holdings.View entire presentation