Planet SPAC Presentation Deck
28
Operational Benchmarking
51%
planet.
1
62%¹
planet.
39%
Z zoominfo
88%
Z zoominfo
37%
CLOUDFLARE
80%
unity
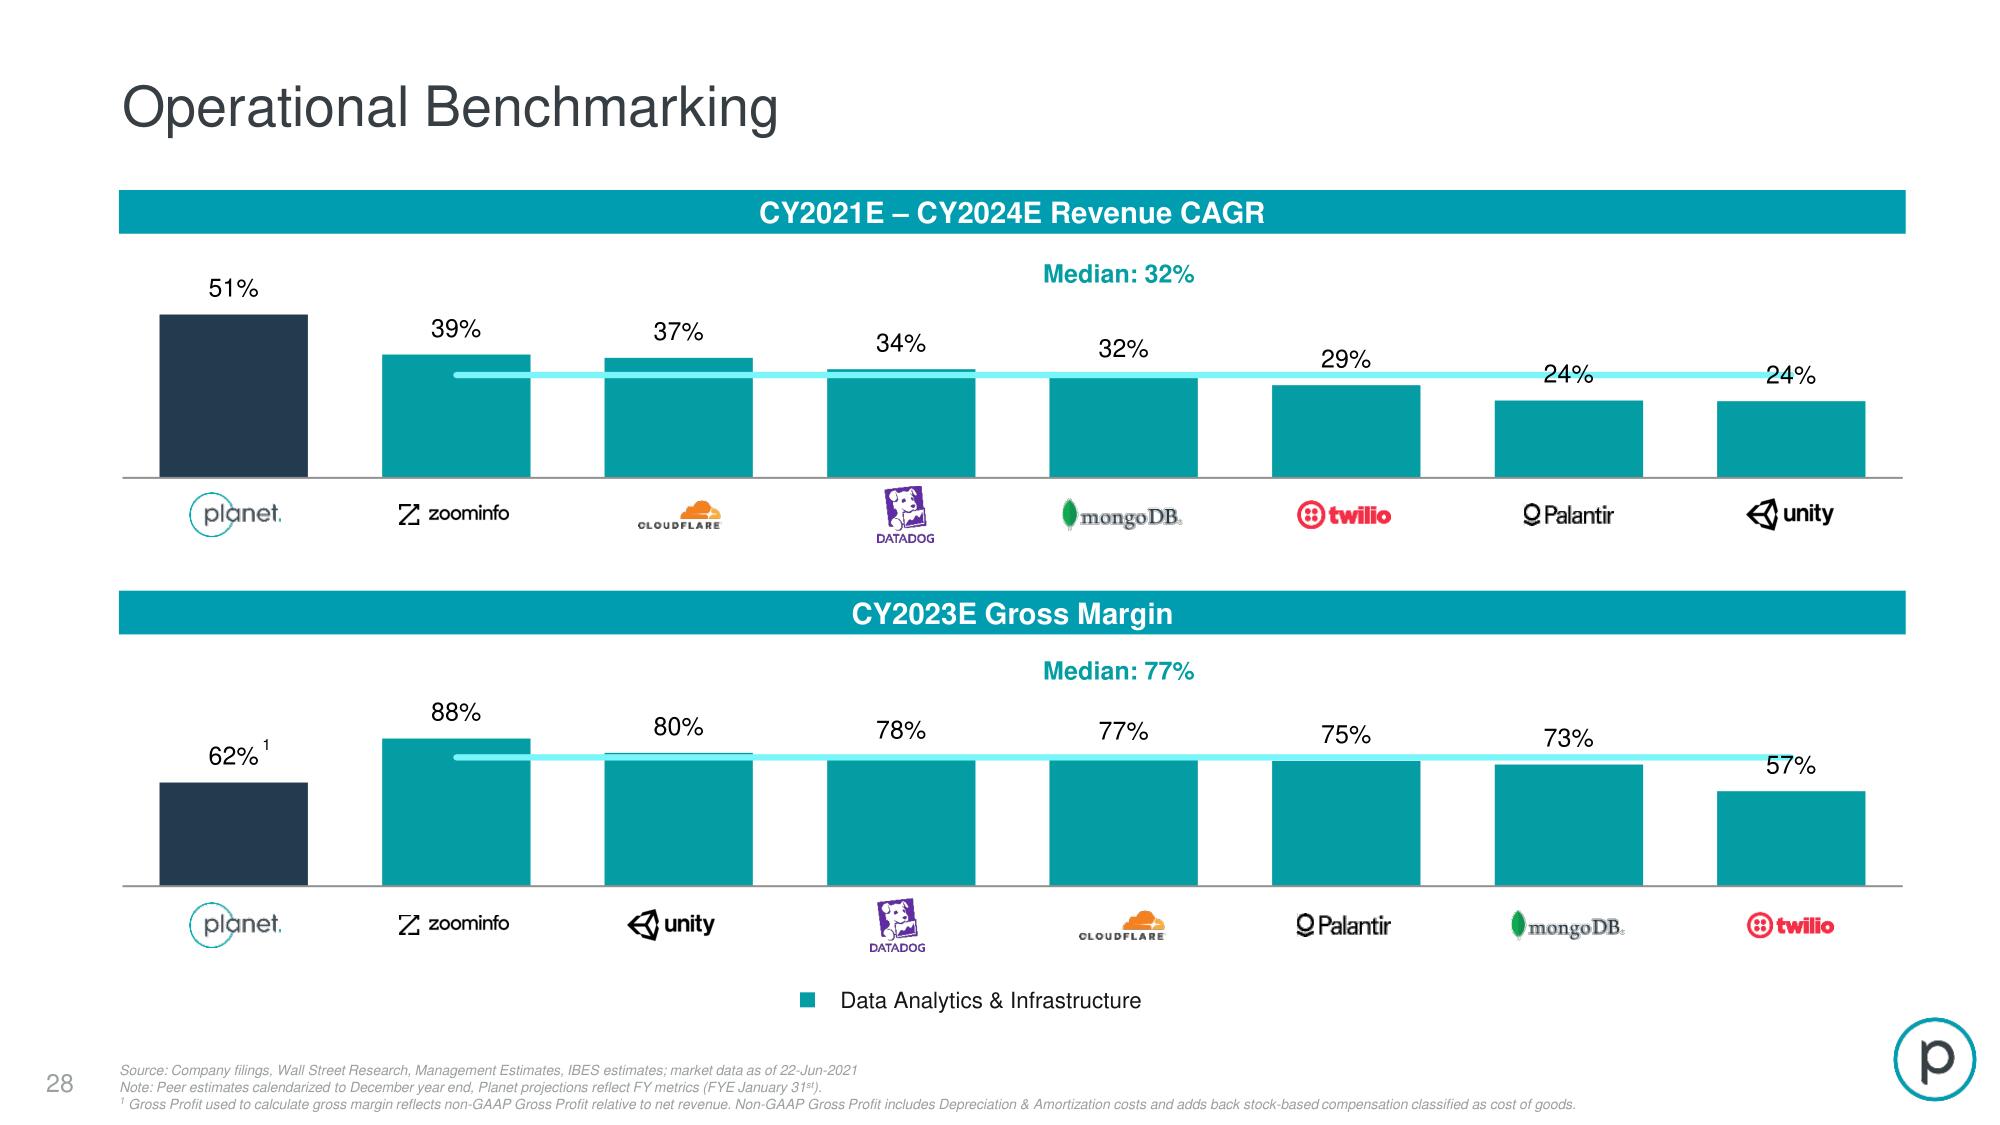
CY2021E-CY2024E Revenue CAGR
34%
SES.
DATADOG
78%
Median: 32%
DATADOG
32%
CY2023E Gross Margin
mongoDB
Median: 77%
77%
CLOUDFLARE
Data Analytics & Infrastructure
29%
twilio
75%
QPalantir
24%
QPalantir
73%
mongoDB
Source: Company filings, Wall Street Research, Management Estimates, IBES estimates; market data as of 22-Jun-2021
Note: Peer estimates calendarized to December year end, Planet projections reflect FY metrics (FYE January 31st).
¹ Gross Profit used to calculate gross margin reflects non-GAAP Gross Profit relative to net revenue. Non-GAAP Gross Profit includes Depreciation & Amortization costs and adds back stock-based compensation classified as cost of goods.
24%
←unity
57%
8 twilio
рView entire presentation