Oaktree Real Estate Opportunities Fund VII, L.P.
OAKTREE REAL ESTATE OPPORTUNITIES FUND VII, L.P.
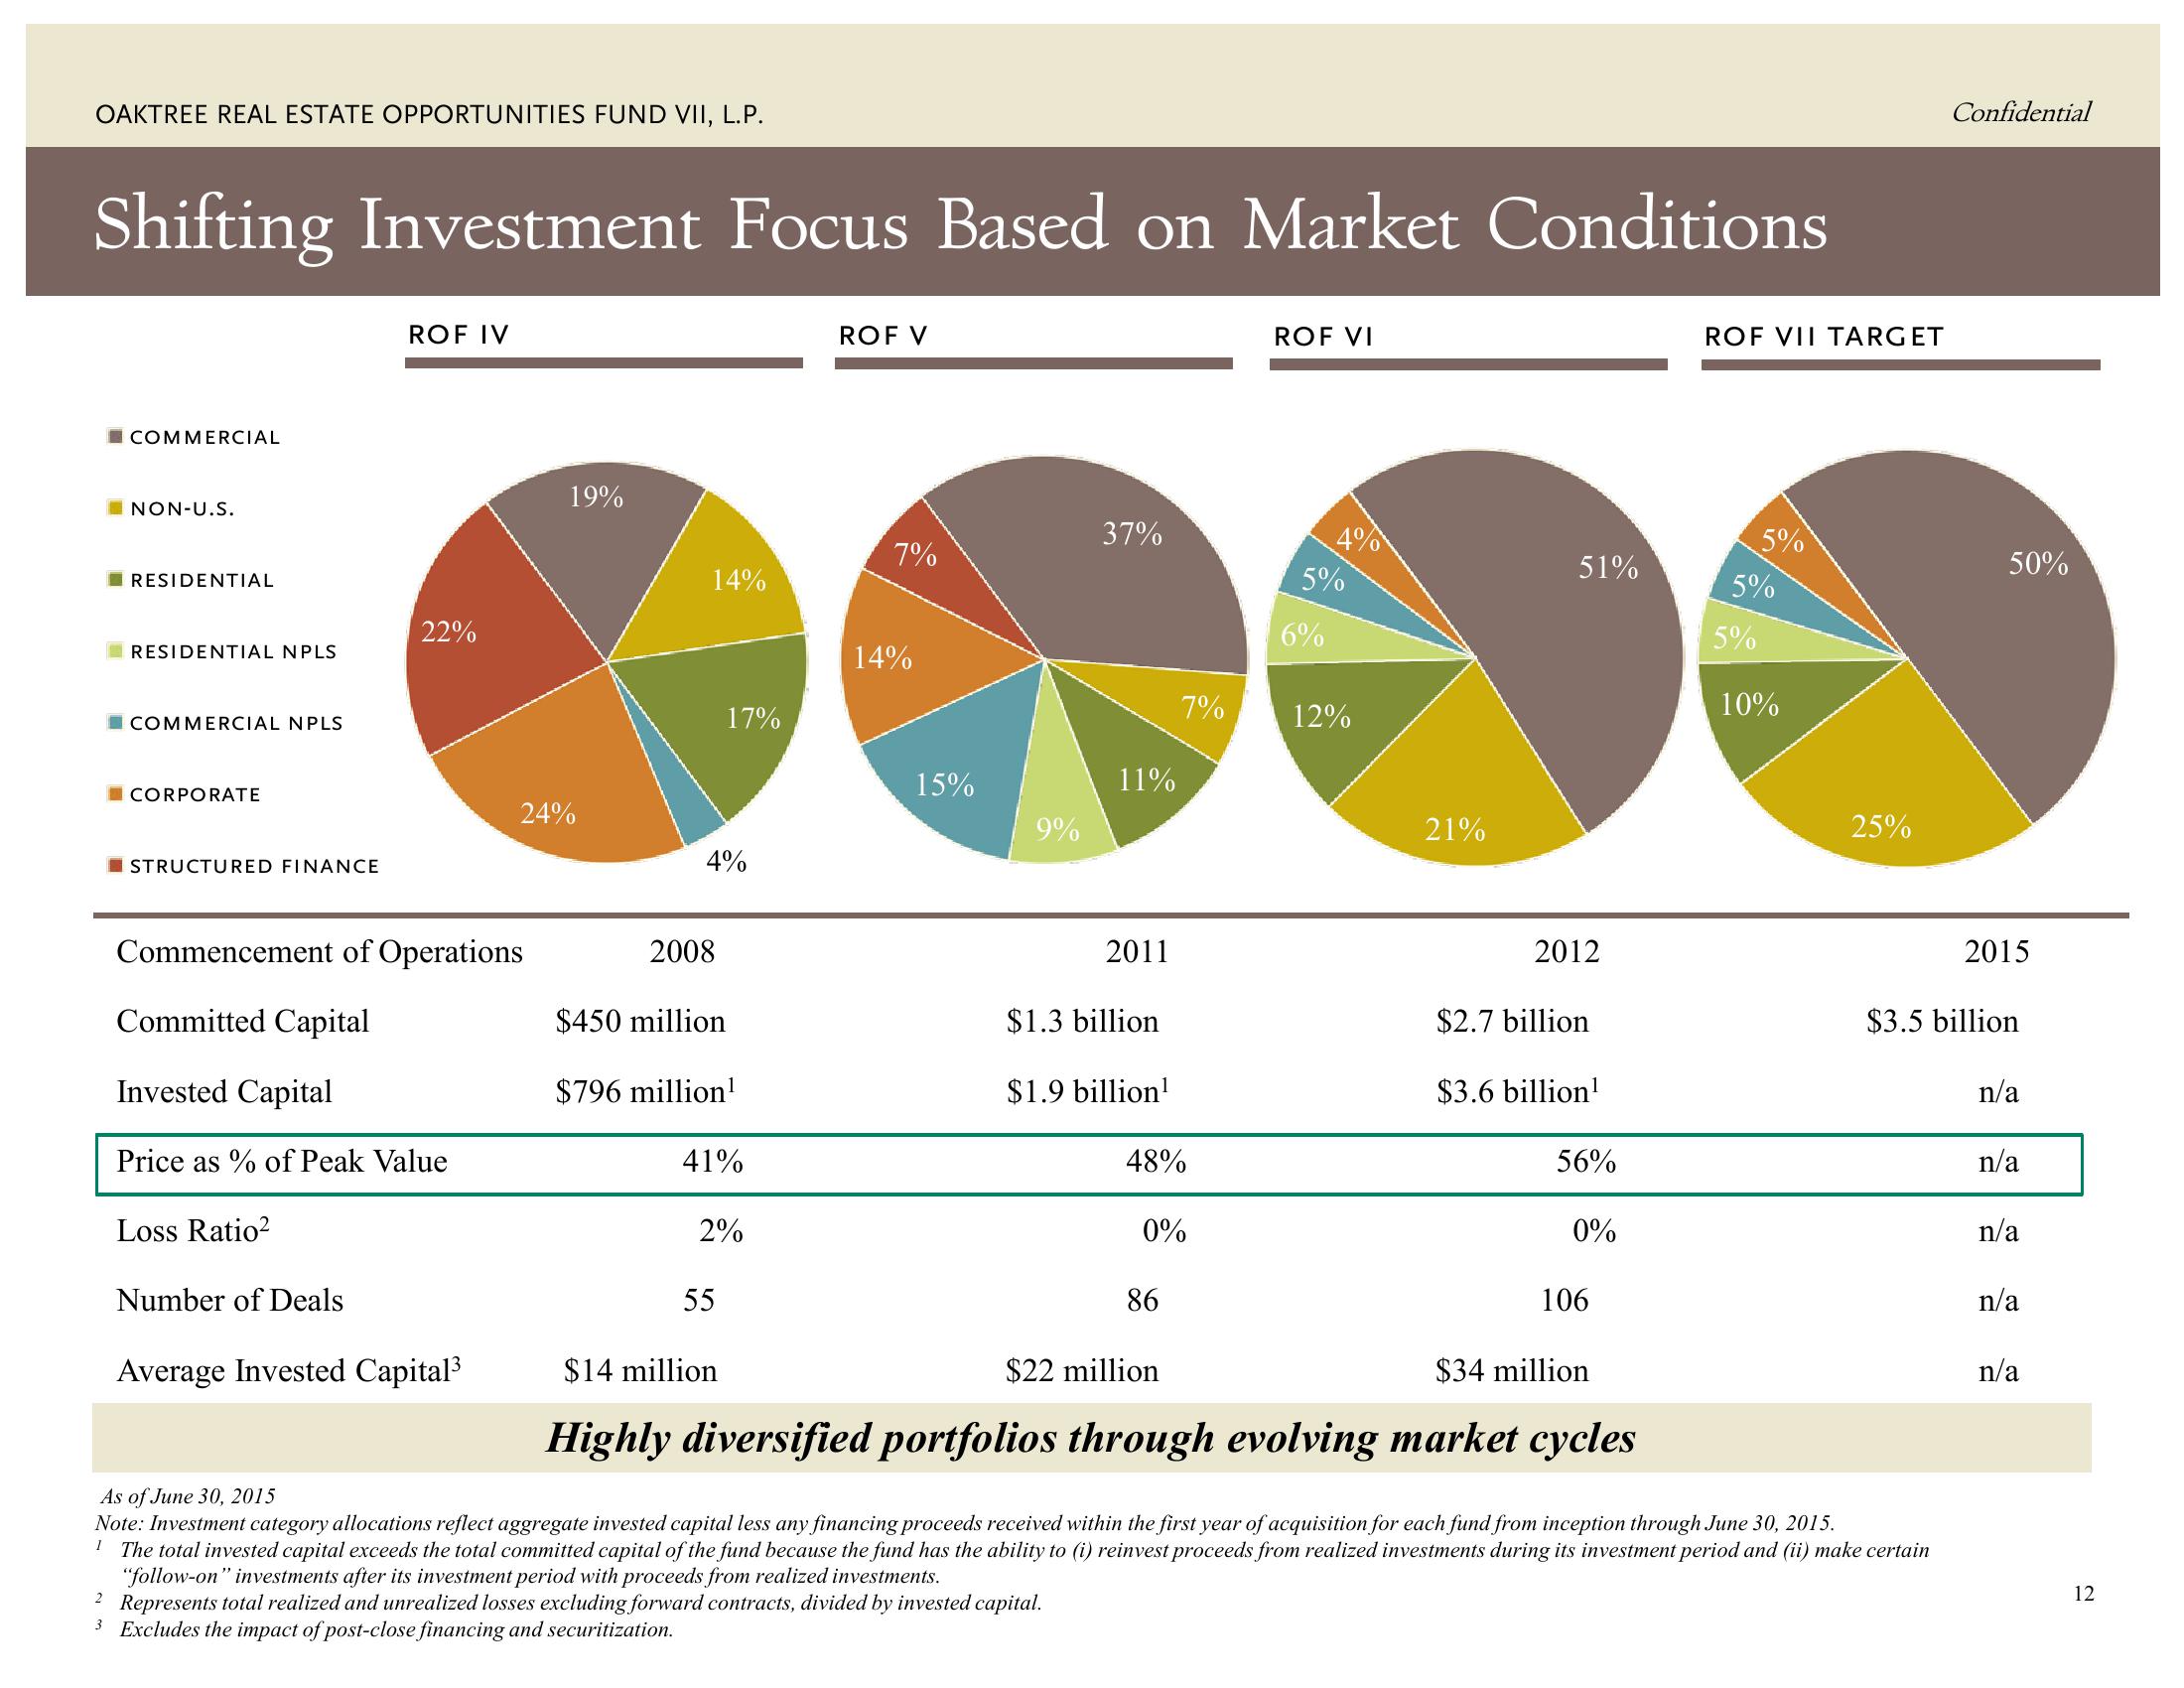
Shifting Investment Focus Based on Market Conditions
COMMERCIAL
NON-U.S.
RESIDENTIAL
RESIDENTIAL NPLS
COMMERCIAL NPLS
CORPORATE
STRUCTURED FINANCE
Loss Ratio²
ROF IV
Number of Deals
22%
Commencement of Operations
Committed Capital
Invested Capital
Price as % of Peak Value
Average Invested Capital³
19%
24%
14%
4%
2008
17%
$450 million
$796 million¹
41%
2%
55
ROF V
7%
14%
15%
9%
37%
11%
2011
$1.3 billion
$1.9 billion¹
2 Represents total realized and unrealized losses excluding forward contracts, divided by invested capital.
3 Excludes the impact of post-close financing and securitization.
7%
48%
0%
86
ROF VI
4%
5%
6%
12%
21%
51%
2012
$2.7 billion
$3.6 billion¹
56%
0%
106
$14 million
$22 million
$34 million
Highly diversified portfolios through evolving market cycles
ROF VII TARGET
5%
5%
5%
10%
25%
As of June 30, 2015
Note: Investment category allocations reflect aggregate invested capital less any financing proceeds received within the first year of acquisition for each fund from inception through June 30, 2015.
1 The total invested capital exceeds the total committed capital of the fund because the fund has the ability to (i) reinvest proceeds from realized investments during its investment period and (ii) make certain
"follow-on" investments after its investment period with proceeds from realized investments.
Confidential
50%
2015
$3.5 billion
n/a
n/a
n/a
n/a
n/a
12View entire presentation