Sonos Results Presentation Deck
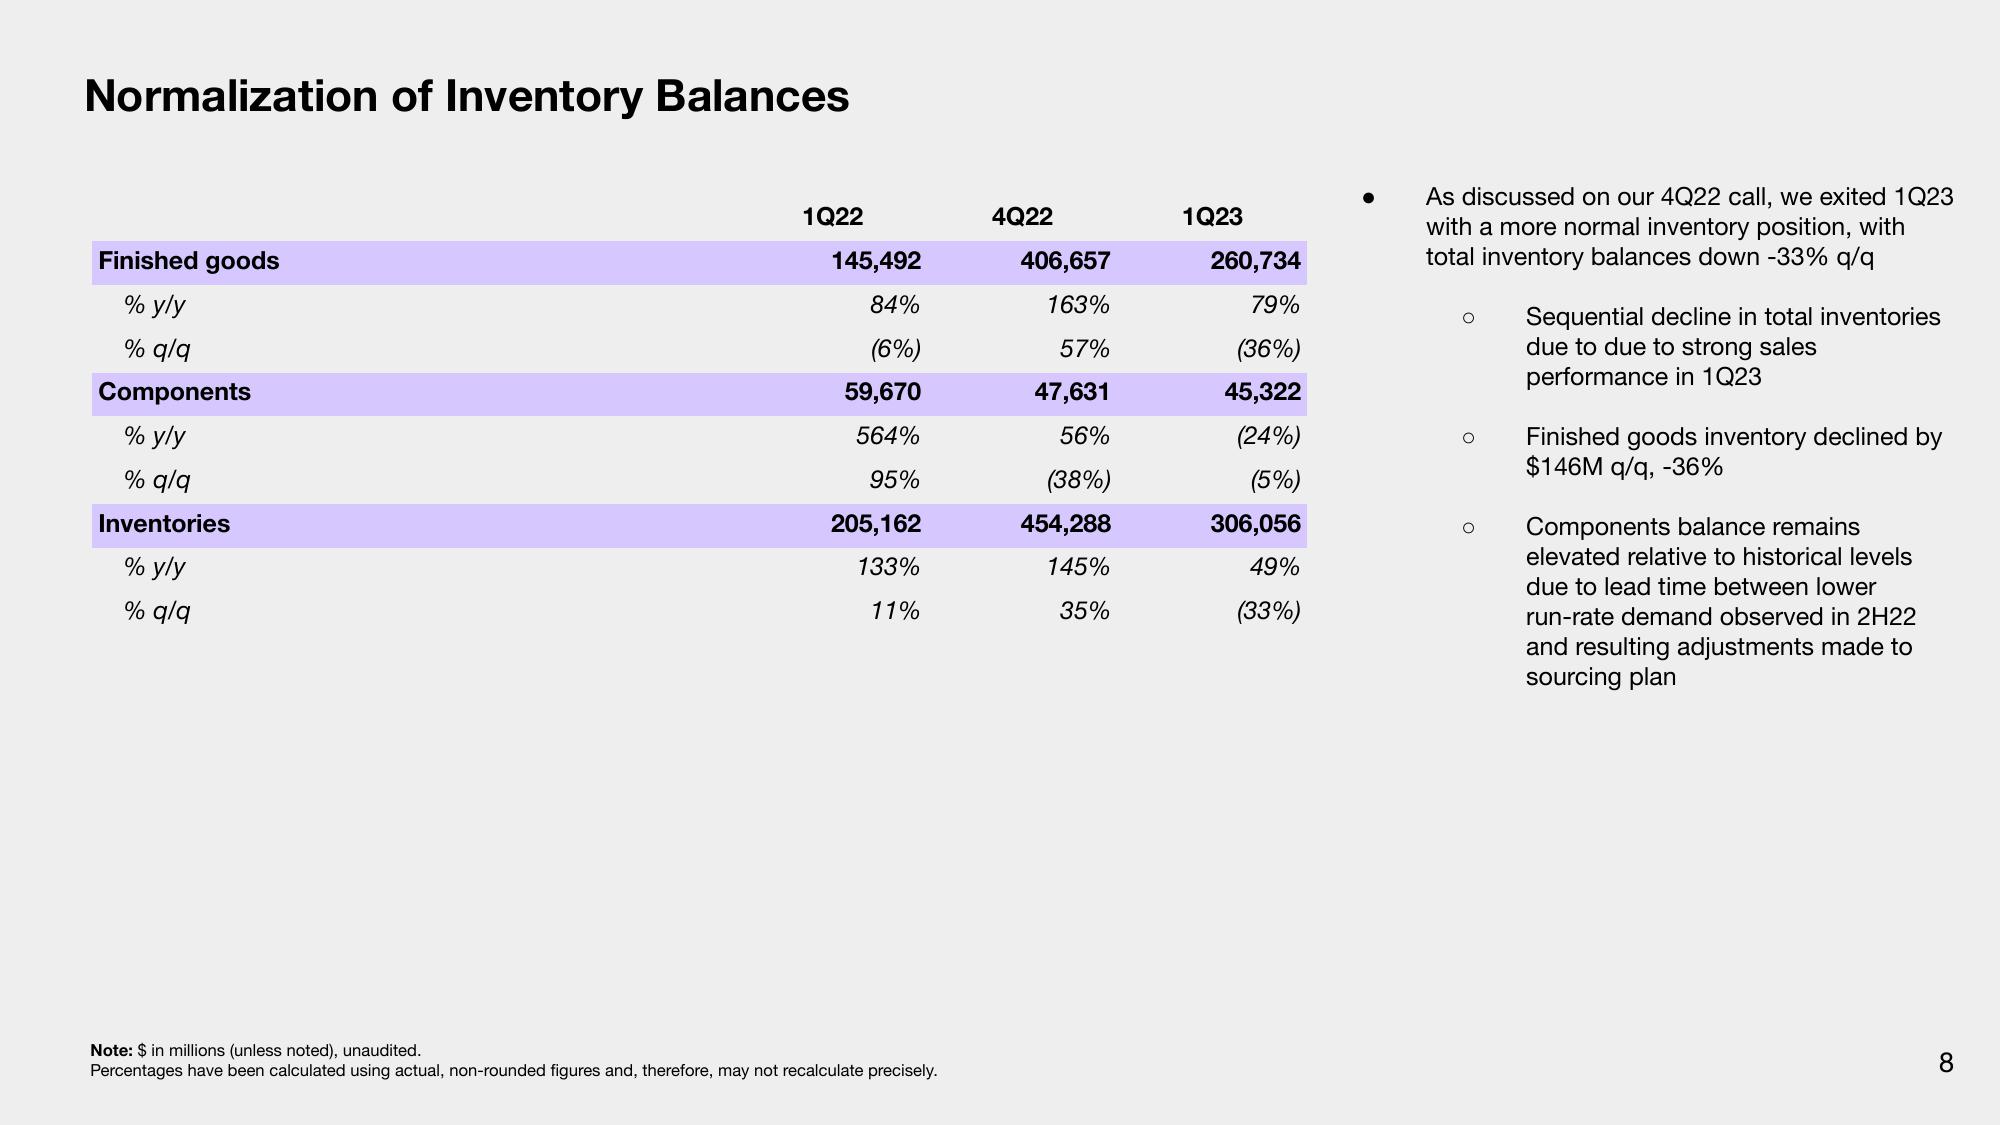
Normalization of Inventory Balances
Finished goods
% y/y
% q/q
Components
% y/y
% q/q
Inventories
% y/y
% q/q
1Q22
145,492
84%
(6%)
59,670
564%
95%
205,162
133%
11%
Note: $ in millions (unless noted), unaudited.
Percentages have been calculated using actual, non-rounded figures and, therefore, may not recalculate precisely.
4Q22
406,657
163%
57%
47,631
56%
(38%)
454,288
145%
35%
1Q23
260,734
79%
(36%)
45,322
(24%)
(5%)
306,056
49%
(33%)
As discussed on our 4Q22 call, we exited 1Q23
with a more normal inventory position, with
total inventory balances down -33% q/q
O
Sequential decline in total inventories
due to due to strong sales
performance in 1Q23
Finished goods inventory declined by
$146M q/q, -36%
Components balance remains
elevated relative to historical levels
due to lead time between lower
run-rate demand observed in 2H22
and resulting adjustments made to
sourcing plan
8View entire presentation