LiveVox Results Presentation Deck slide image

LiveVox Results Presentation Deck

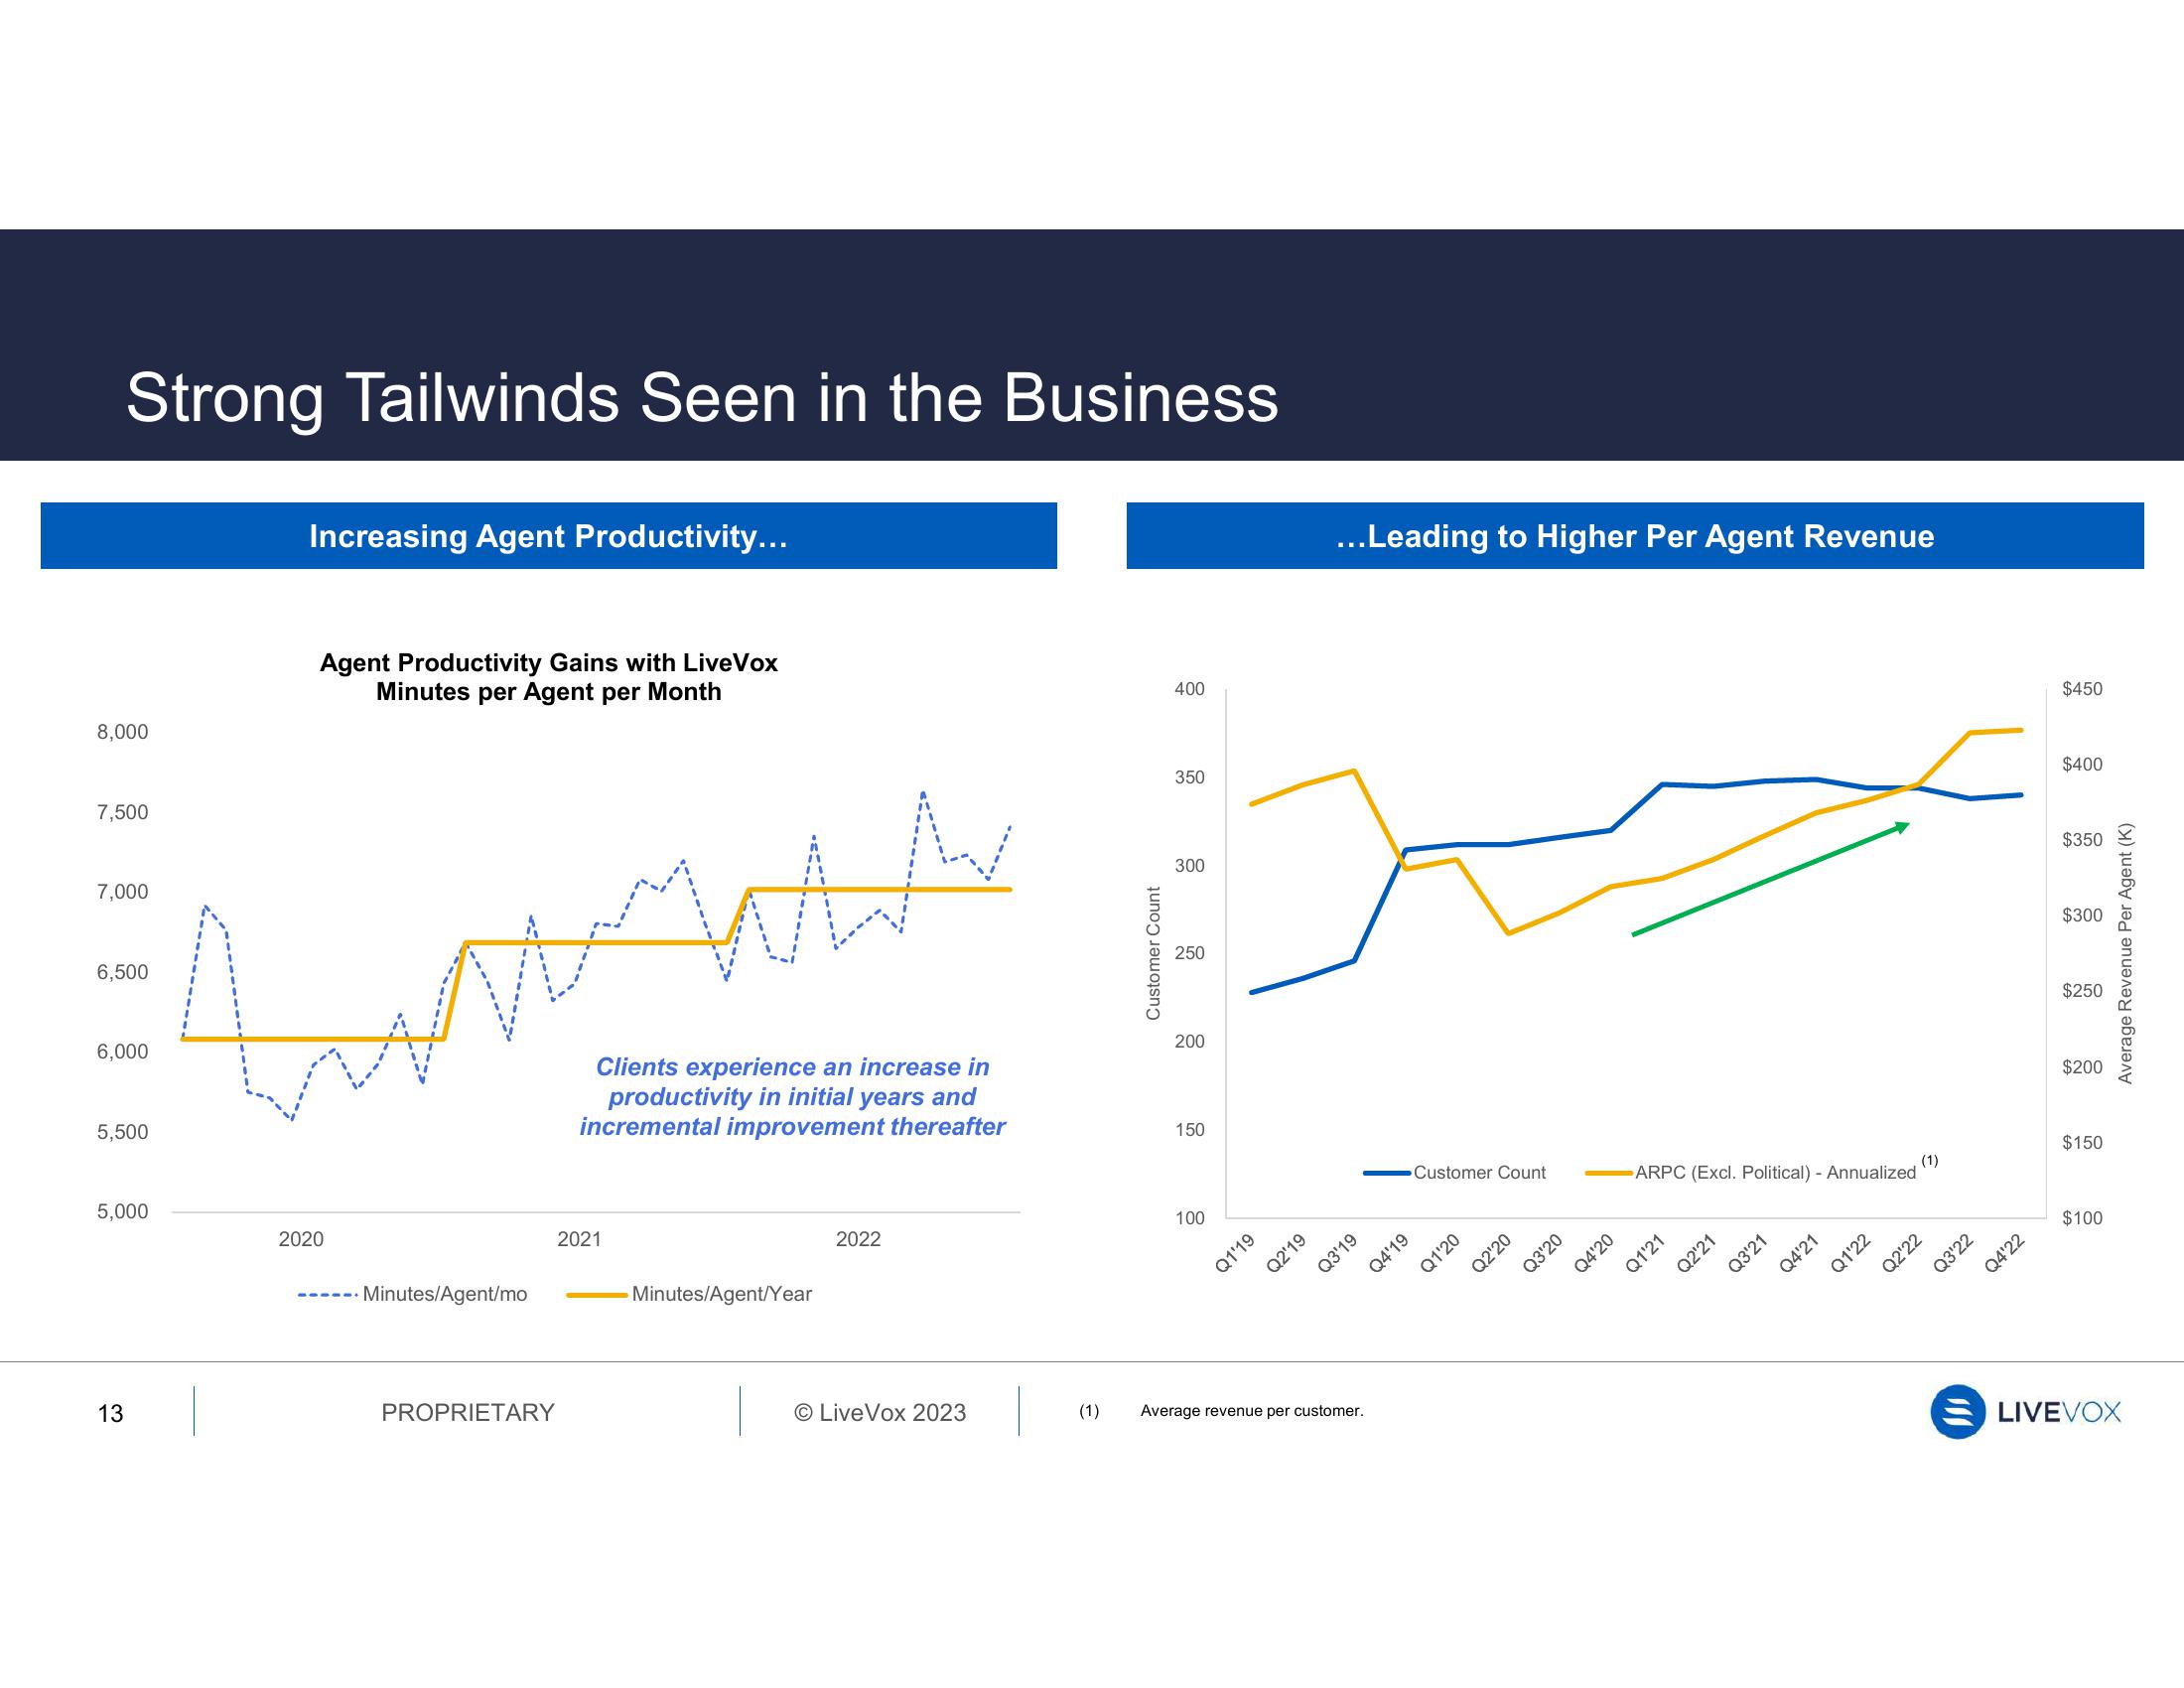
Strong Tailwinds Seen in the Business 8,000 7,500 7,000 6,500 6,000 5,500 5,000 13 Increasing Agent Productivity... Agent Productivity Gains with LiveVox Minutes per Agent per Month 2020 ------ Minutes/Agent/mo гал Clients experience an increase in productivity in initial years and incremental improvement thereafter PROPRIETARY 2021 Minutes/Agent/Year 2022 O LiveVox 2023 (1) Customer Count 400 350 300 250 200 150 100 Q1'19 Q2'19 ...Leading to Higher Per Agent Revenue Q3'19 Average revenue per customer. Q4'19 Customer Count Q1'20 Q2'20 Q3'20 Q4'20 ARPC (Excl. Political) - Annualized Q1'21 Q2'21 Q3'21 Q4'21 Q1'22 (1) Q2'22 Q3'22 Q4'22 $450 $400 $350 $300 $250 $200 $150 $100 Average Revenue Per Agent (K) LIVEVOX
View entire presentation