Uber Results Presentation Deck
Continued:
Condensed
Consolidated
Balance Sheets
(Unaudited)
$ in Millions
Uber Q3 2023 Earnings
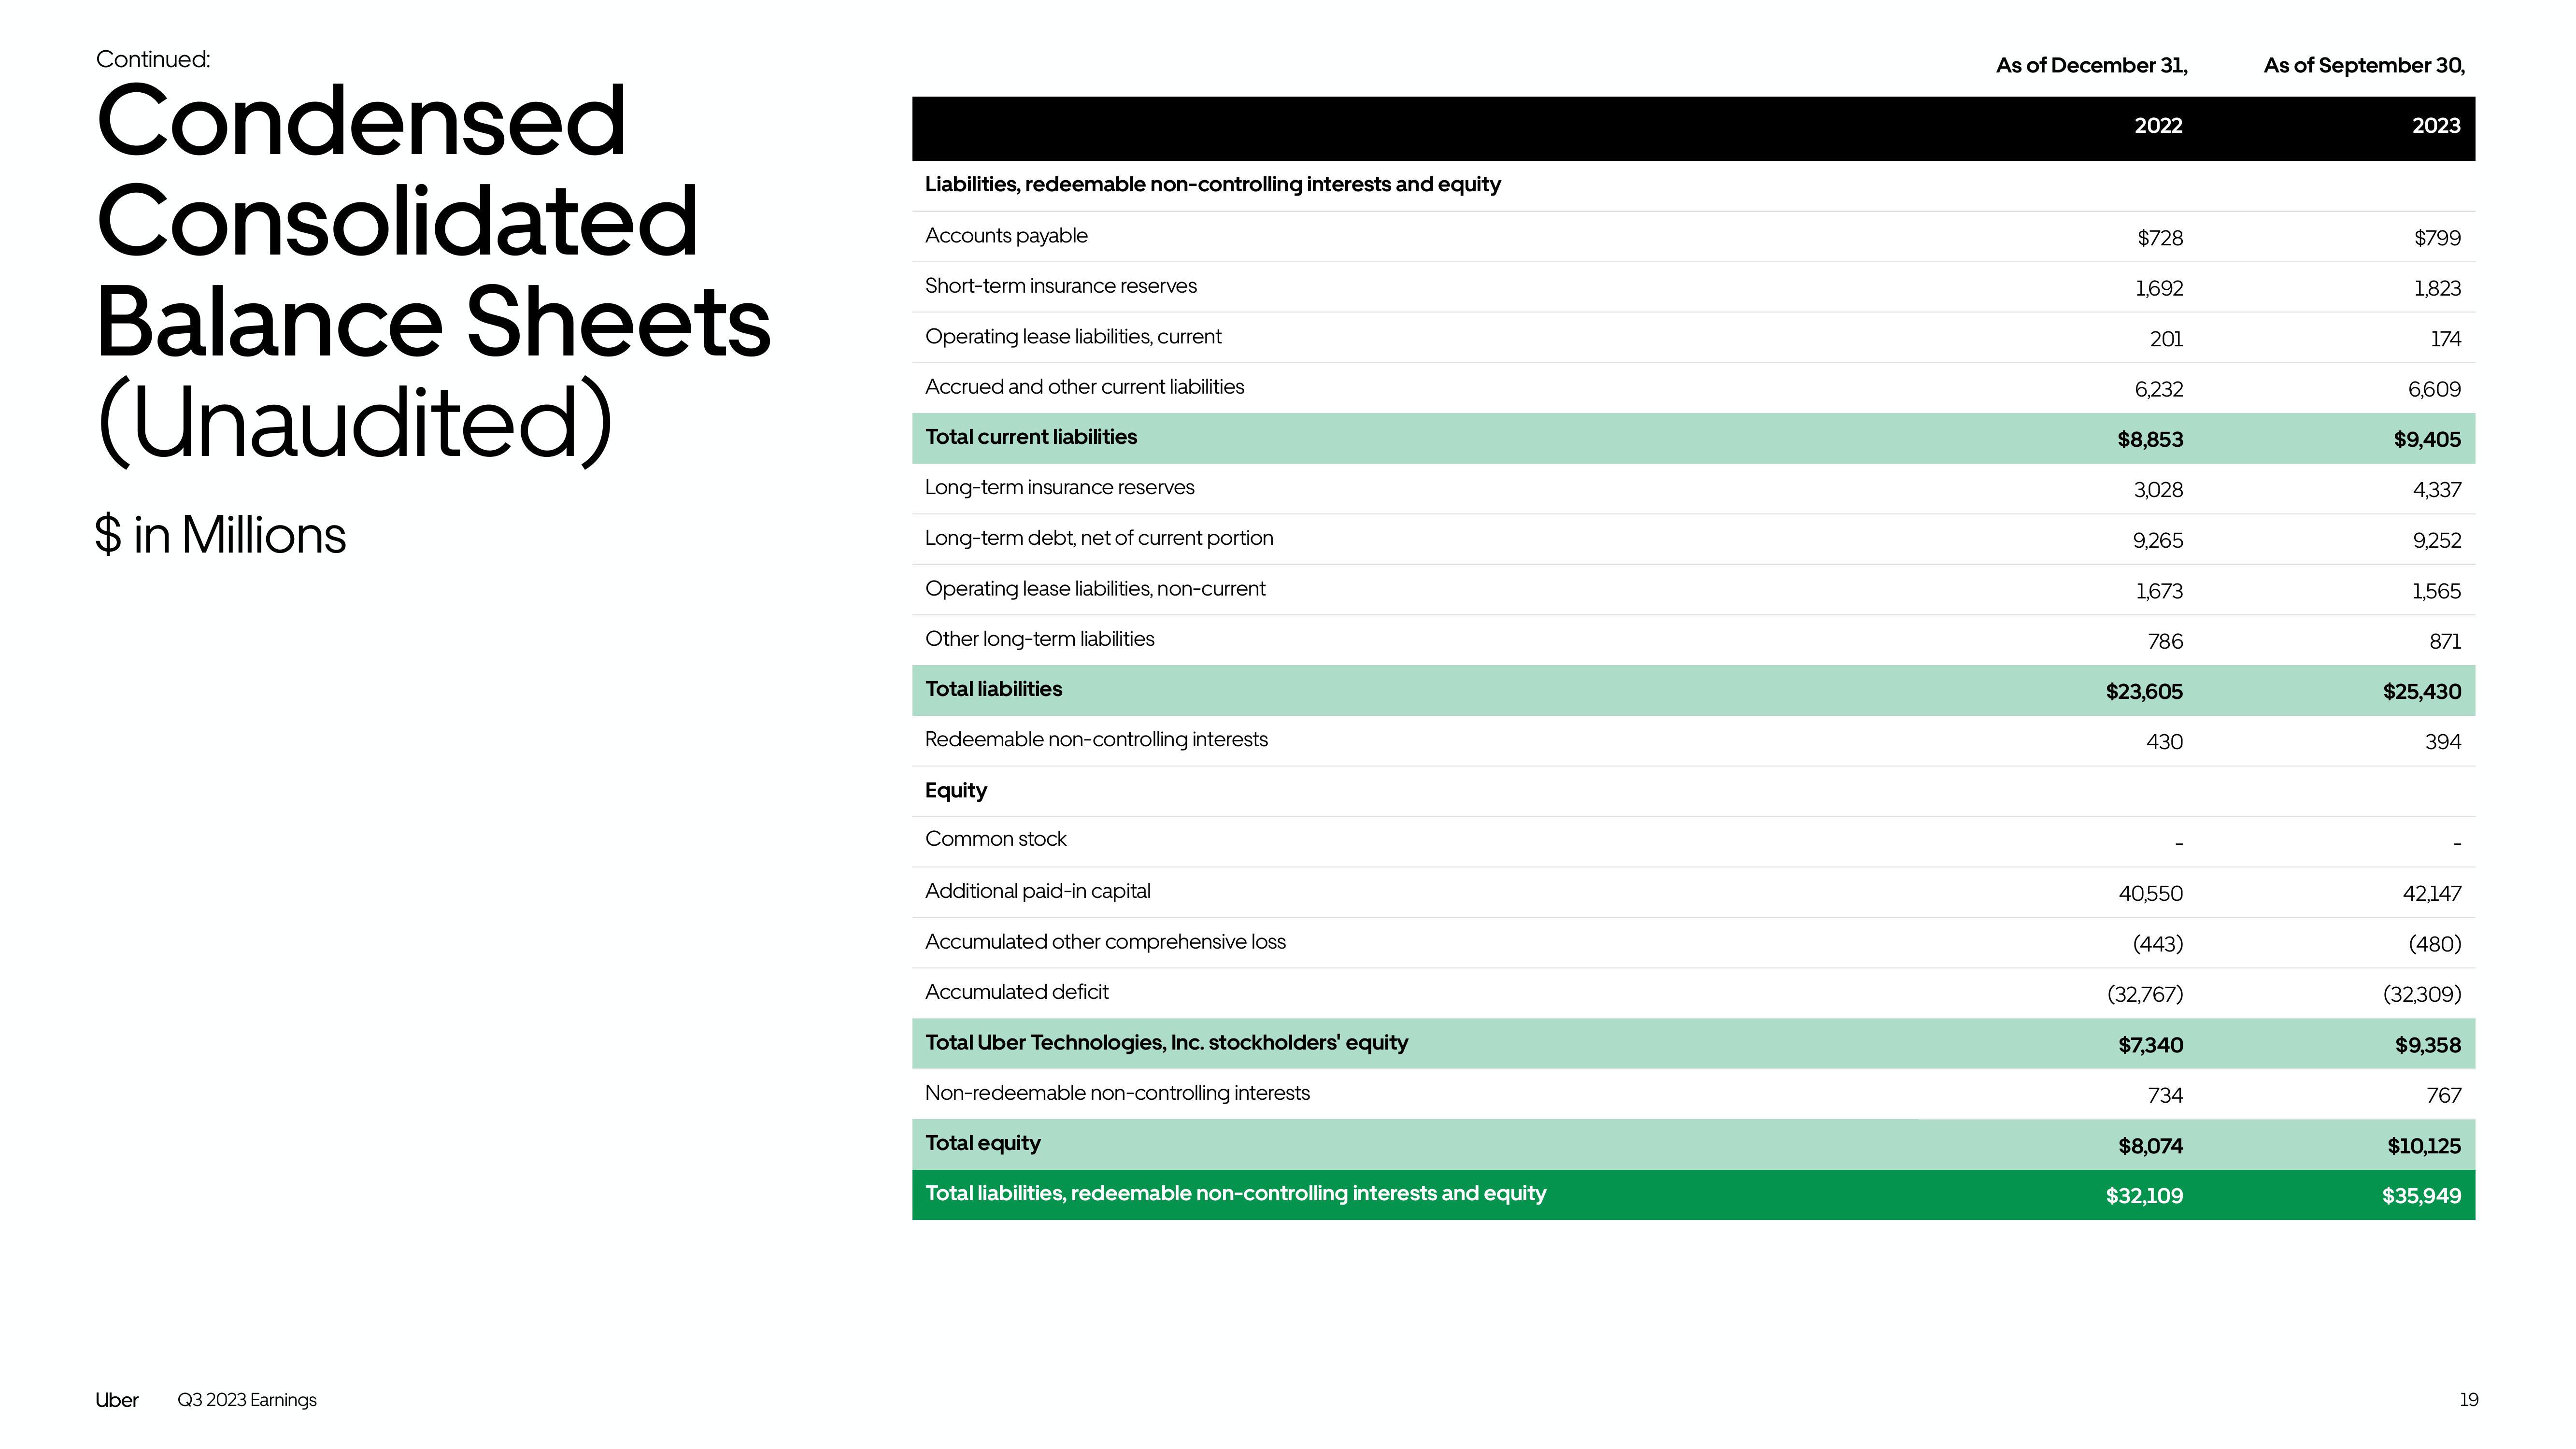
Liabilities, redeemable non-controlling interests and equity
Accounts payable
Short-term insurance reserves
Operating lease liabilities, current
Accrued and other current liabilities
Total current liabilities
Long-term insurance reserves
Long-term debt, net of current portion
Operating lease liabilities, non-current
Other long-term liabilities
Total liabilities
Redeemable non-controlling interests
Equity
Common stock
Additional paid-in capital
Accumulated other comprehensive loss
Accumulated deficit
Total Uber Technologies, Inc. stockholders' equity
Non-redeemable non-controlling interests
Total equity
Total liabilities, redeemable non-controlling interests and equity
As of December 31,
2022
$728
1,692
201
6,232
$8,853
3,028
9,265
1,673
786
$23,605
430
40,550
(443)
(32,767)
$7,340
734
$8,074
$32,109
As of September 30,
2023
$799
1,823
174
6,609
$9,405
4,337
9,252
1,565
871
$25,430
394
42,147
(480)
(32,309)
$9,358
767
$10,125
$35,949
19View entire presentation