Kin SPAC Presentation Deck
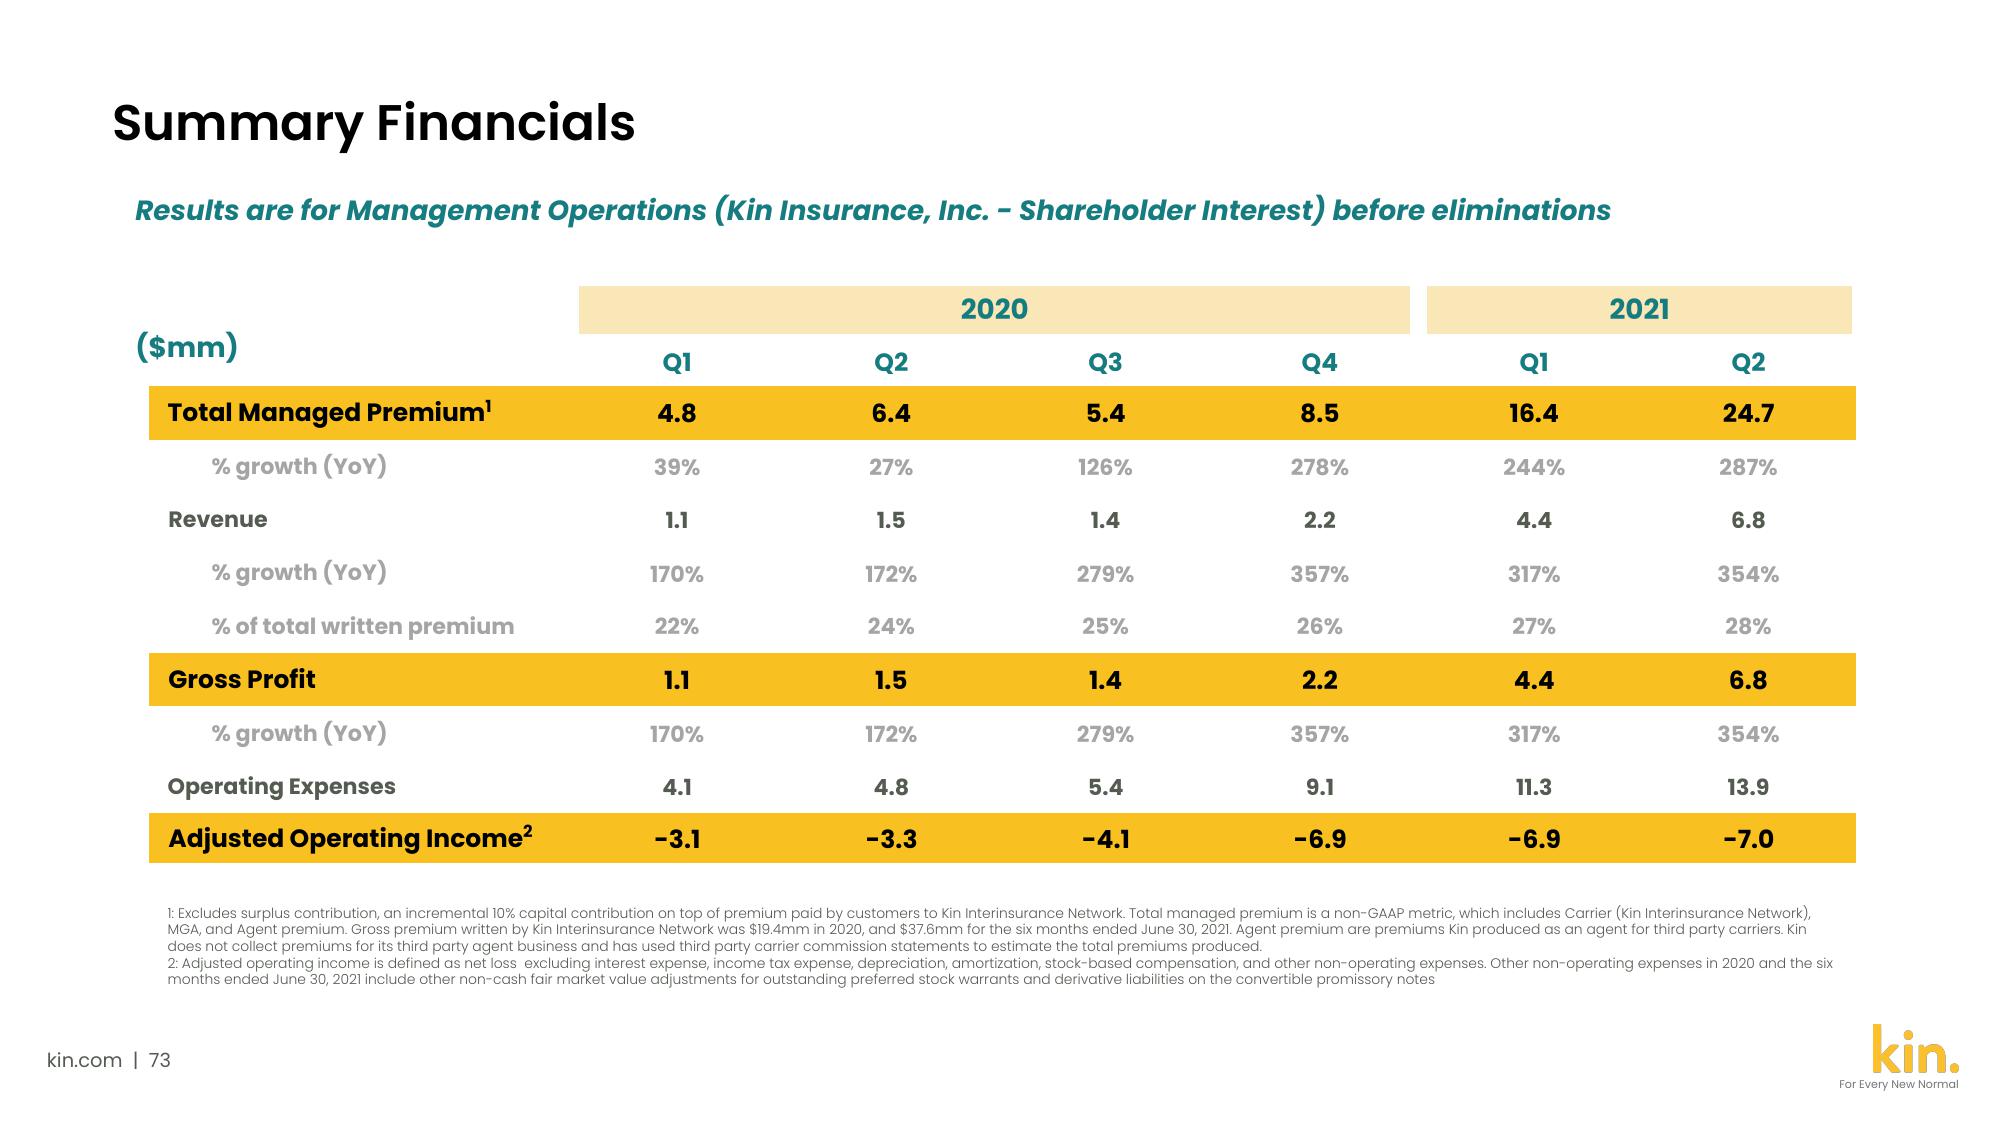
Summary Financials
Results are for Management Operations (Kin Insurance, Inc. - Shareholder Interest) before eliminations
($mm)
Total Managed Premium¹
% growth (YoY)
Revenue
% growth (YoY)
% of total written premium
Gross Profit
% growth (YoY)
Operating Expenses
Adjusted Operating Income²
Q1
4.8
kin.com | 73
39%
1.1
170%
22%
1.1
170%
4.1
-3.1
Q2
6.4
27%
1.5
172%
24%
1.5
172%
4.8
-3.3
2020
Q3
5.4
126%
1.4
279%
25%
1.4
279%
5.4
-4.1
Q4
8.5
278%
2.2
357%
26%
2.2
357%
9.1
-6.9
Q1
16.4
244%
4.4
317%
27%
4.4
317%
11.3
-6.9
2021
Q2
24.7
287%
6.8
354%
28%
6.8
354%
13.9
-7.0
1: Excludes surplus contribution, an incremental 10% capital contribution on top of premium paid by customers to Kin Interinsurance Network. Total managed premium is a non-GAAP metric, which includes Carrier (Kin Interinsurance Network),
MGA, and Agent premium. Gross premium written by Kin Interinsurance Network was $19.4mm in 2020, and $37.6mm for the six months ended June 30, 2021. Agent premium are premiums Kin produced as an agent for third party carriers. Kin
does not collect premiums for its third party agent business and has used third party carrier commission statements to estimate the total premiums produced.
2: Adjusted operating income is defined as net loss excluding interest expense, income tax expense, depreciation, amortization, stock-based compensation, and other non-operating expenses. Other non-operating expenses in 2020 and the six
months ended June 30, 2021 include other non-cash fair market value adjustments for outstanding preferred stock warrants and derivative liabilities on the convertible promissory notes
kin.
For Every New NormalView entire presentation