Cyxtera Investor Presentation Deck
Capital Expenditures
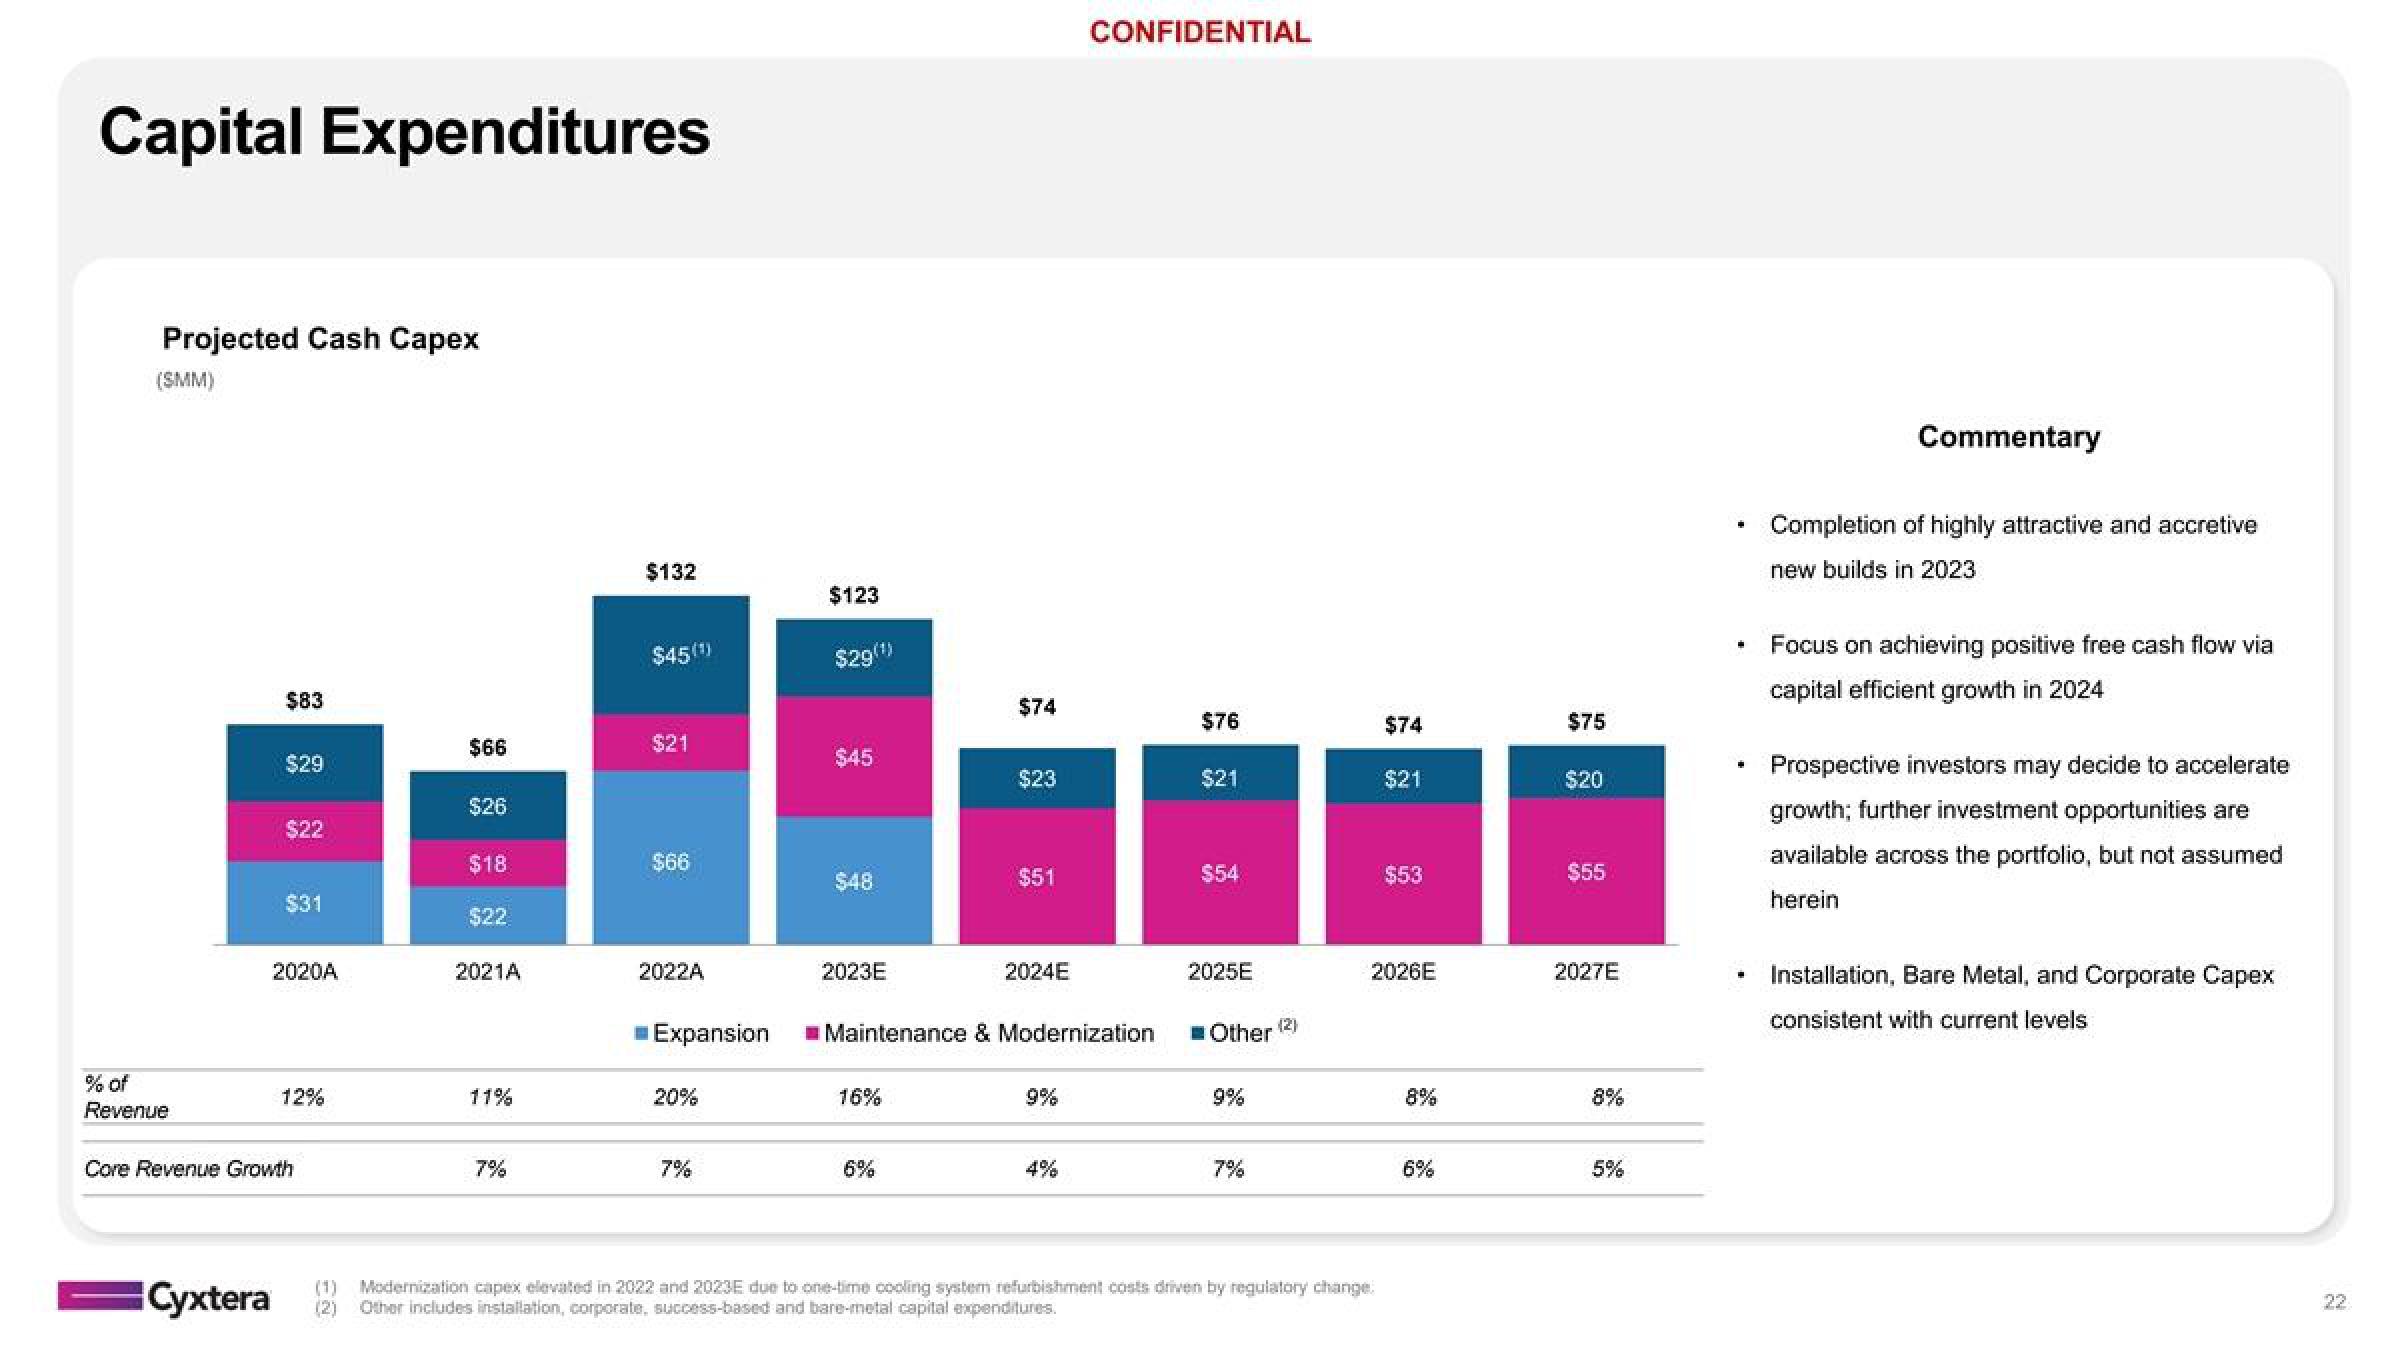
Projected Cash Capex
(SMM)
% of
Revenue
$83
Cyxtera
$29
$22
$31
2020A
12%
Core Revenue Growth
$66
$26
$18
$22
2021A
11%
7%
$132
$45 (¹)
$21
$66
2022A
Expansion
20%
7%
and
$123
$29(¹)
$45
$48
2023E
16%
$74
6%
$23
$51
2024E
Maintenance & Modernization
CONFIDENTIAL
9%
$76
$21
$54
2025E
Other
9%
7%
(2)
capex elevated in
-time cooling system refurbishment costs driven by regulatory change.
(2) Other includes installation, corporate, success-based and bare-metal capital expenditures.
$74
$21
2018
2026E
8%
6%
$75
$20
$55
2027E
5%
Commentary
Completion of highly attractive and accretive
new builds in 2023
Focus on achieving positive free cash flow via
capital efficient growth in 2024
Prospective investors may decide to accelerate
growth; further investment opportunities are
available across the portfolio, but not assumed
herein
Installation, Bare Metal, and Corporate Capex
consistent with current levelsView entire presentation