Paya SPAC Presentation Deck
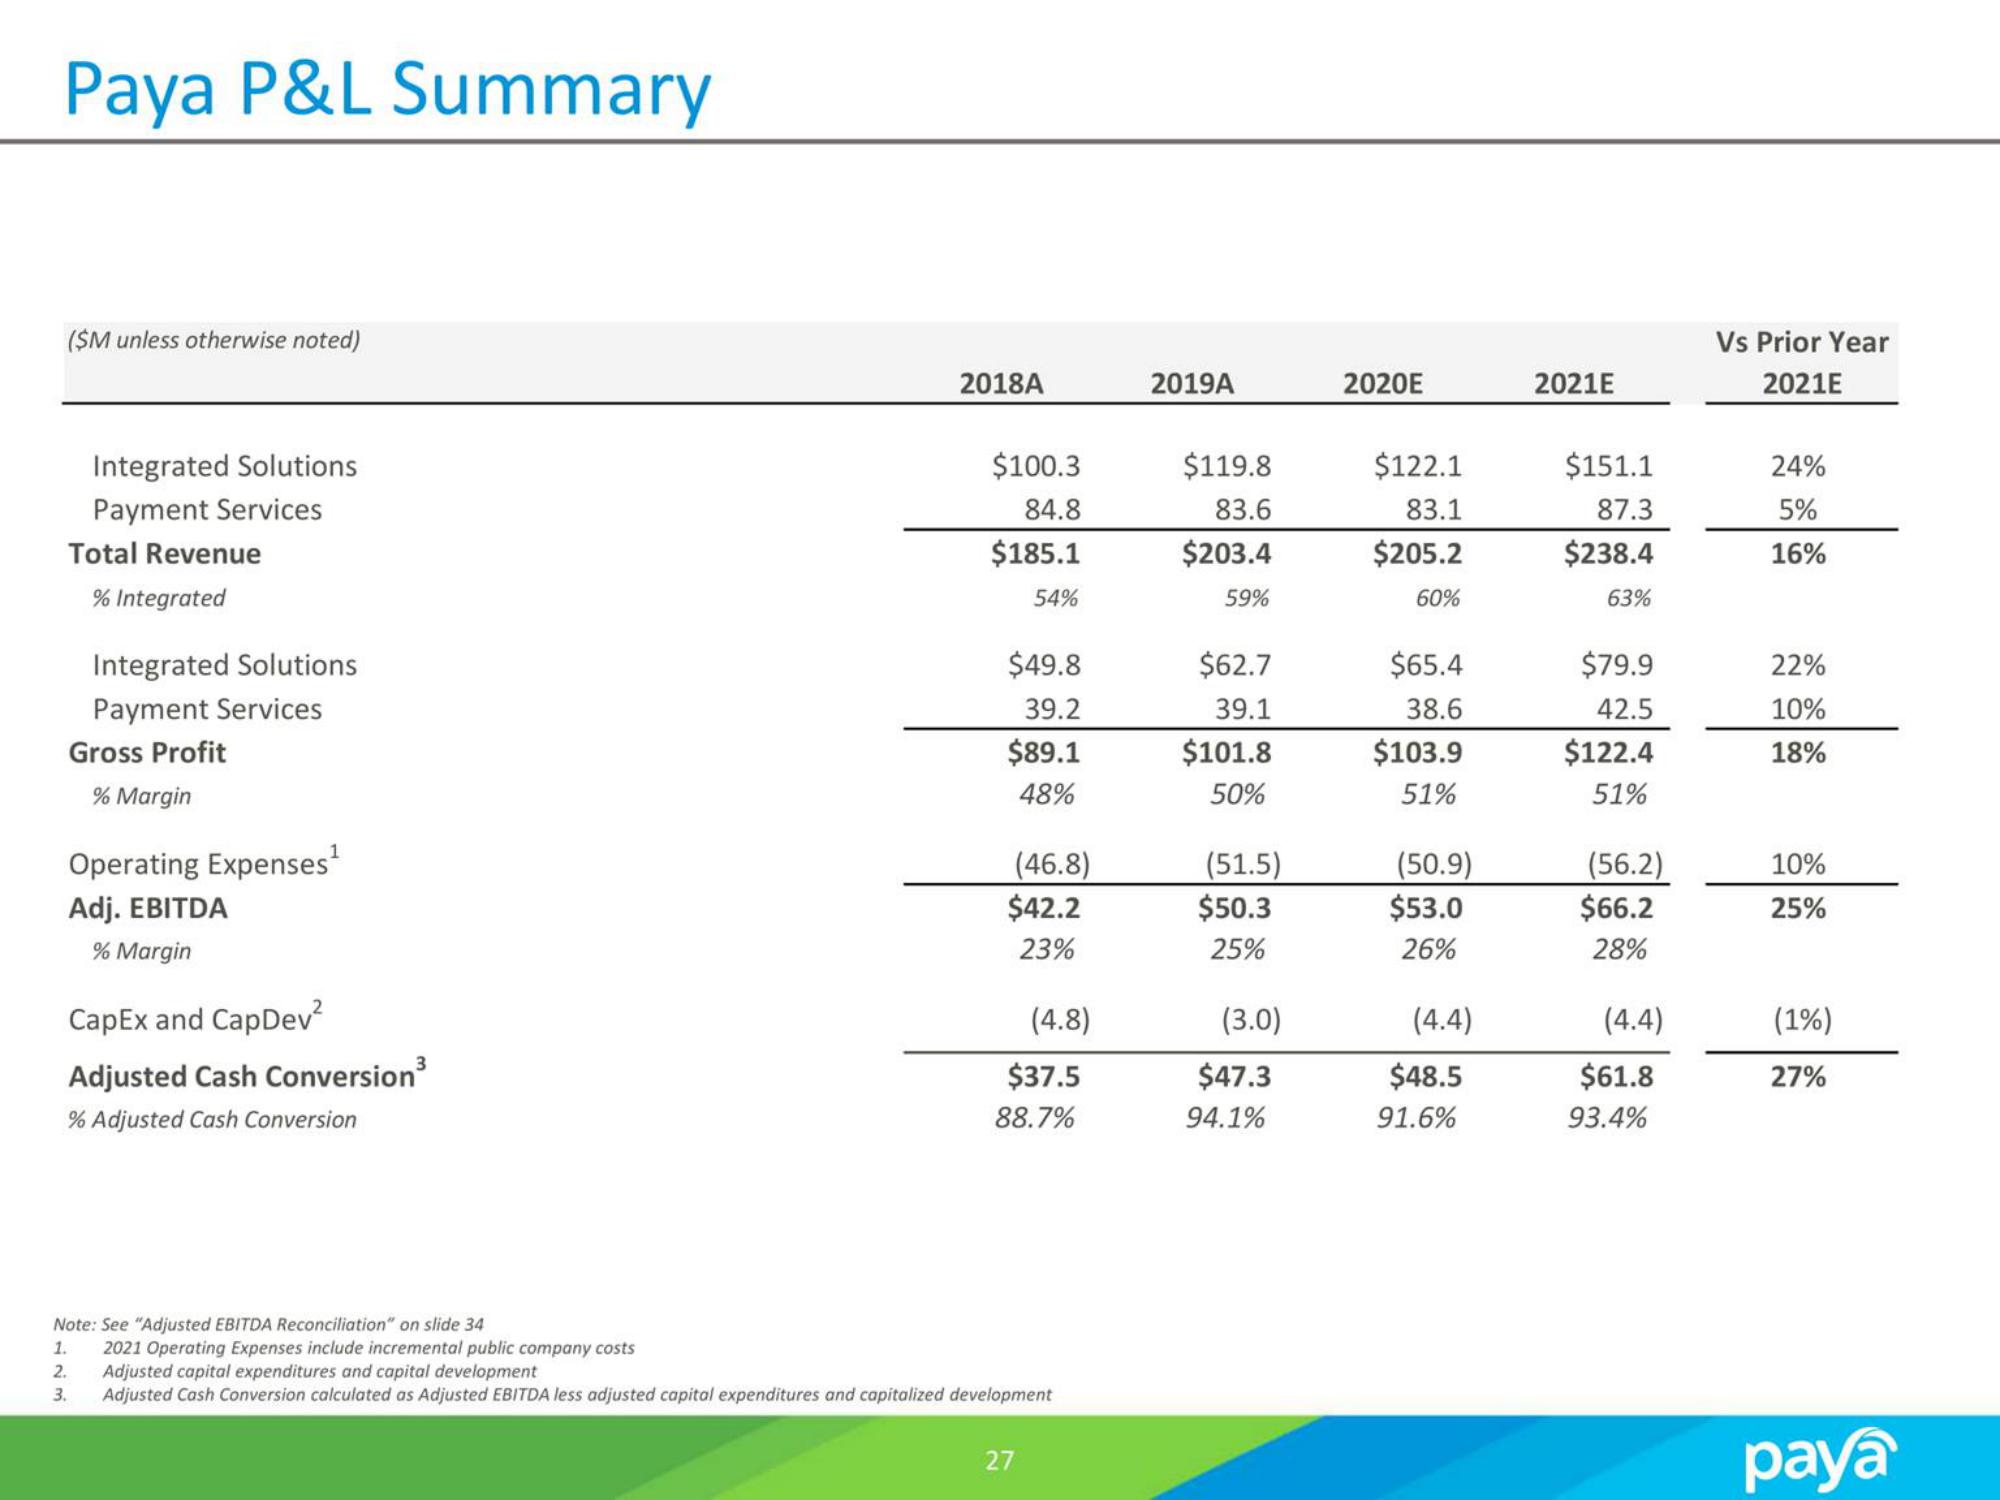
Paya P&L Summary
($M unless otherwise noted)
Integrated Solutions
Payment Services
Total Revenue
% Integrated
Integrated Solutions
Payment Services
Gross Profit
% Margin
Operating Expenses¹
Adj. EBITDA
% Margin
CapEx and CapDev²
Adjusted Cash Conversion ³
% Adjusted Cash Conversion
2018A
$100.3
84.8
$185.1
54%
$49.8
39.2
$89.1
48%
(46.8)
$42.2
23%
(4.8)
$37.5
88.7%
Note: See "Adjusted EBITDA Reconciliation" on slide 34
1. 2021 Operating Expenses include incremental public company costs
2. Adjusted capital expenditures and capital development
3.
Adjusted Cash Conversion calculated as Adjusted EBITDA less adjusted capital expenditures and capitalized development
27
2019A
$119.8
83.6
$203.4
59%
$62.7
39.1
$101.8
50%
(51.5)
$50.3
25%
(3.0)
$47.3
94.1%
2020E
$122.1
83.1
$205.2
60%
$65.4
38.6
$103.9
51%
(50.9)
$53.0
26%
(4.4)
$48.5
91.6%
2021E
$151.1
87.3
$238.4
63%
$79.9
42.5
$122.4
51%
(56.2)
$66.2
28%
(4.4)
$61.8
93.4%
Vs Prior Year
2021E
24%
5%
16%
22%
10%
18%
10%
25%
(1%)
27%
payaView entire presentation