Experian ESG Presentation Deck
Executive Summary
Improving Financial Health
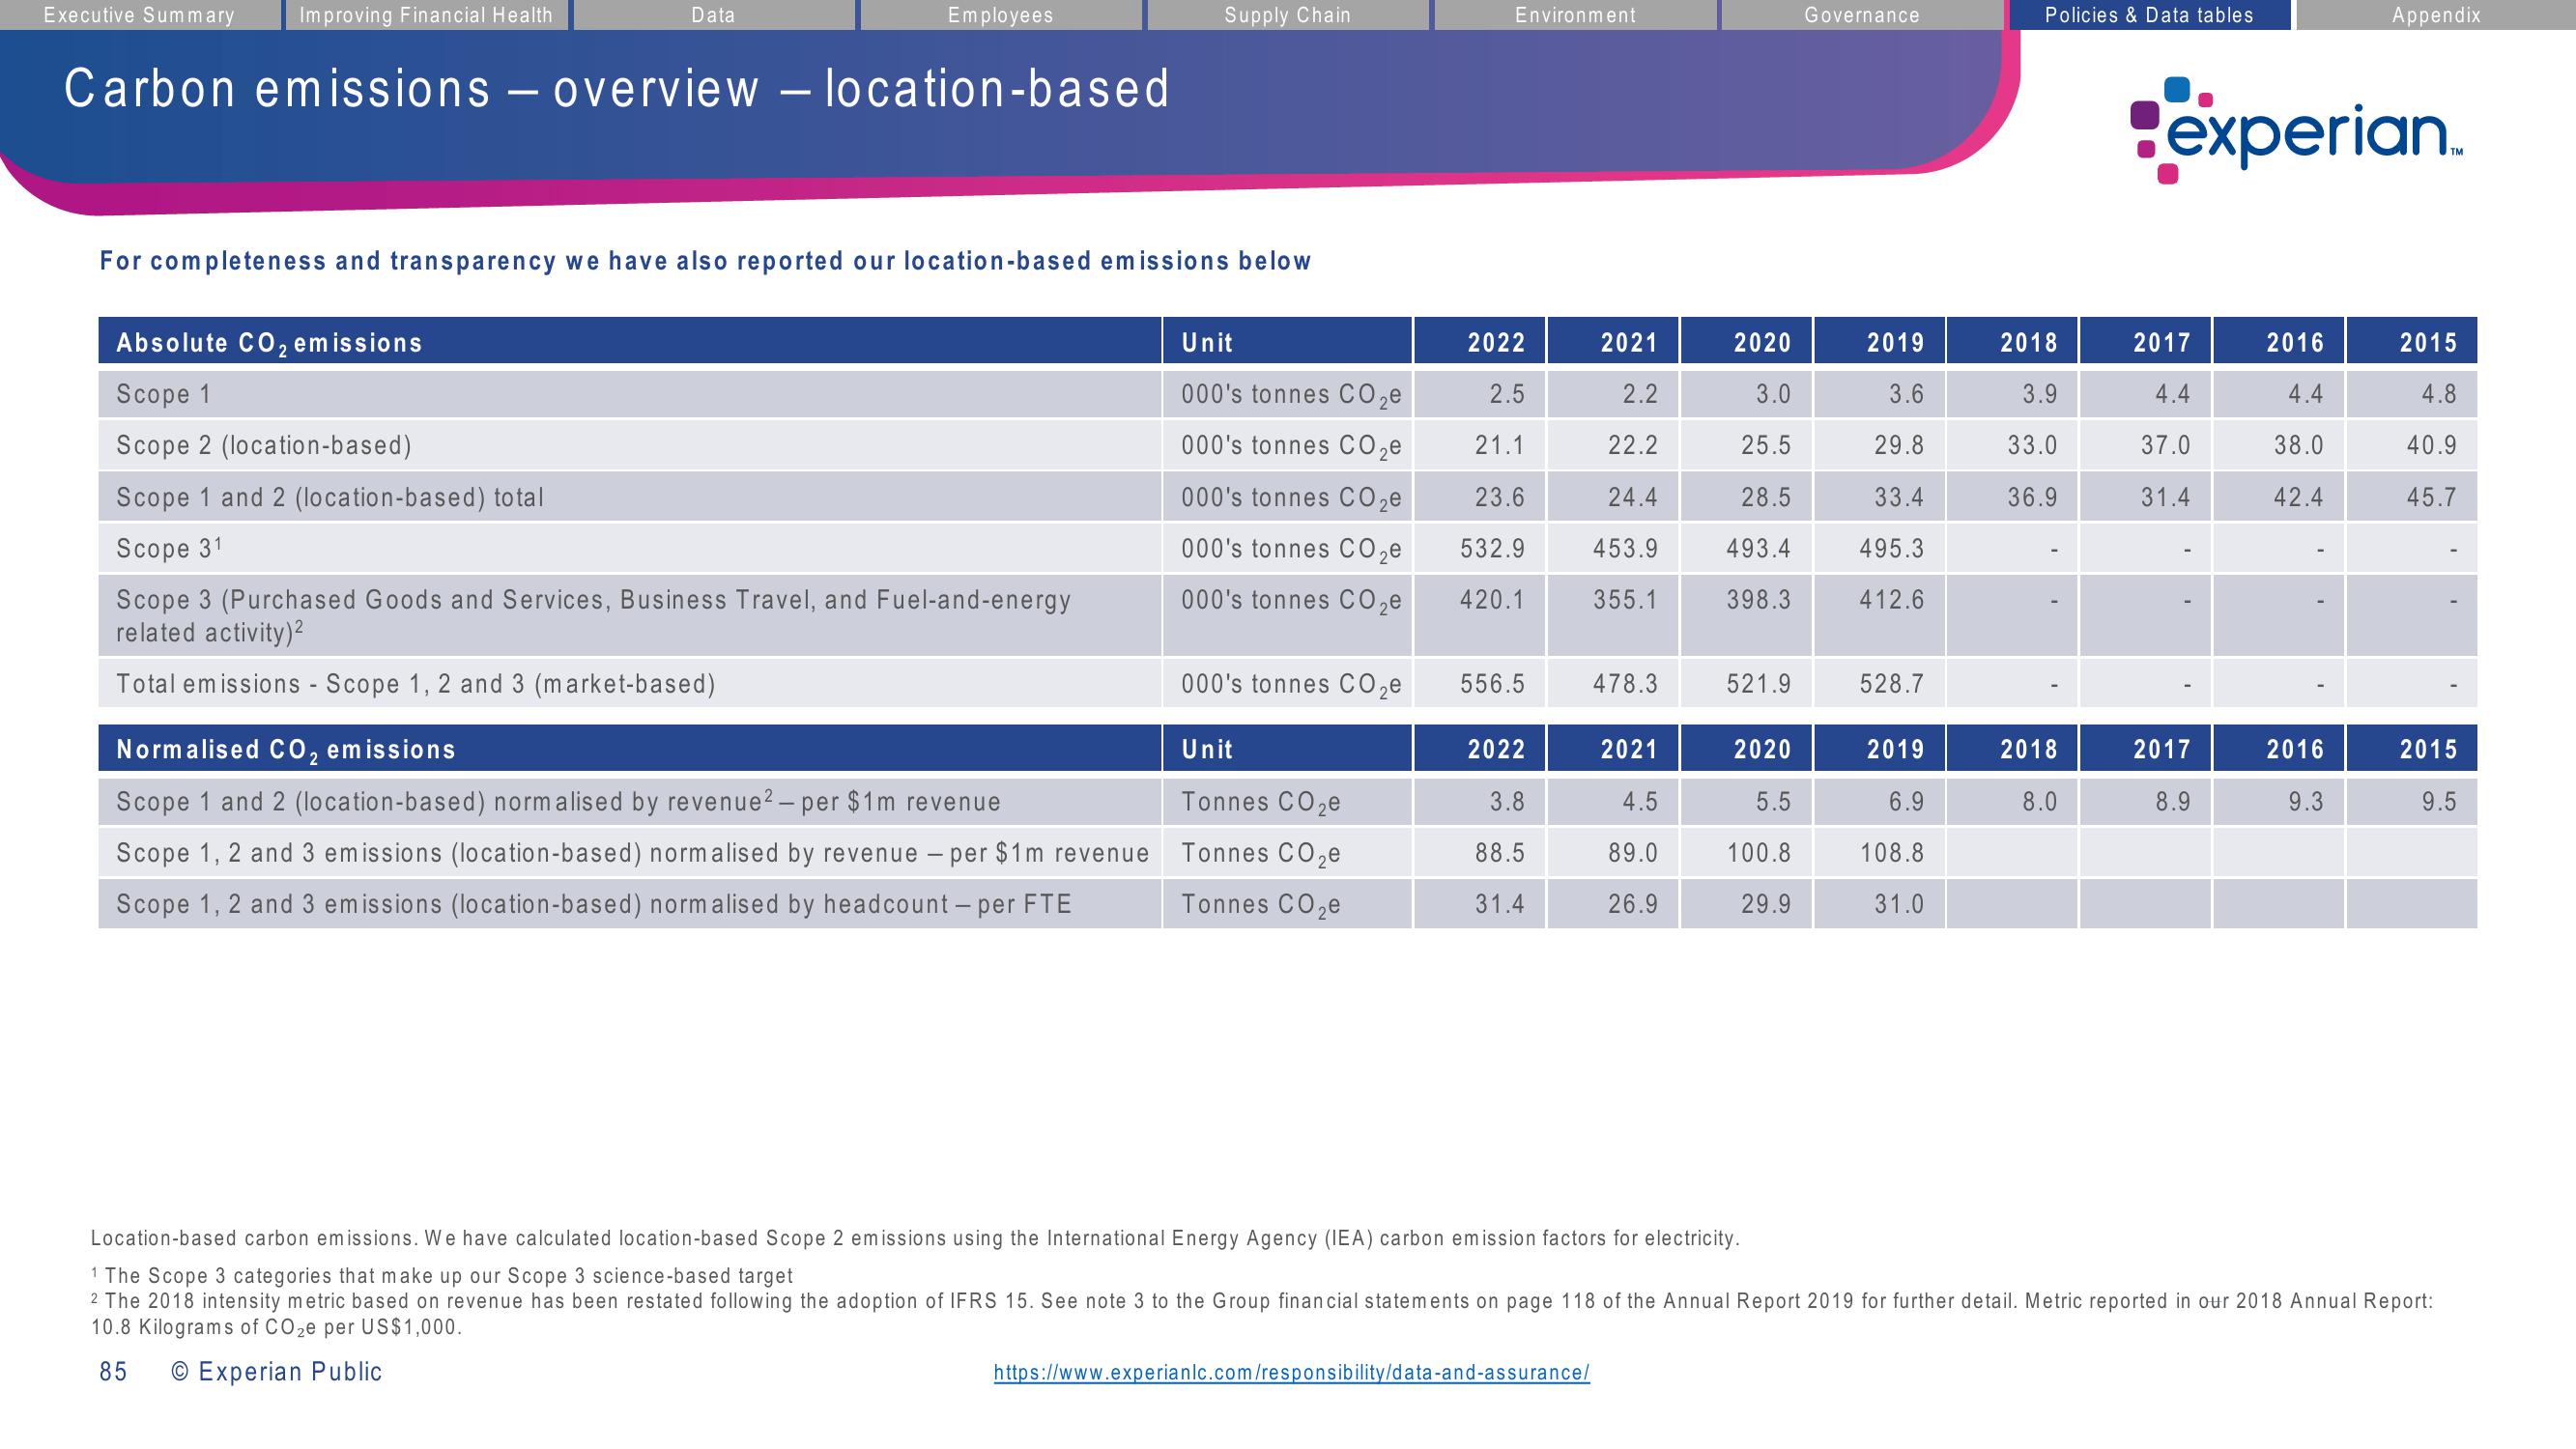
Carbon emissions - overview - location-based
Data
Absolute CO₂ emissions
2
Scope 1
Scope 2 (location-based)
Scope 1 and 2 (location-based) total
Scope 31
Employees
For completeness and transparency we have also reported our location-based emissions below
Scope 3 (Purchased Goods and Services, Business Travel, and Fuel-and-energy
related activity)²
Total emissions - Scope 1, 2 and 3 (market-based)
Normalised CO₂ emissions
Scope 1 and 2 (location-based) normalised by revenue ² - per $1m revenue
Scope 1, 2 and 3 emissions (location-based) normalised by revenue per $1m revenue
Scope 1, 2 and 3 emissions (location-based) normalised by headcount - per FTE
-
Supply Chain
Unit
000's tonnes CO₂e
000's tonnes CO₂e
000's tonnes CO ₂e
000's tonnes CO₂e
000's tonnes CO₂e
000's tonnes CO₂e
Unit
Tonnes CO₂e
Tonnes CO₂e
Tonnes CO₂e
Environment
2022
2.5
21.1
23.6
532.9
420.1
556.5
2022
3.8
88.5
31.4
2021
2.2
22.2
24.4
453.9
355.1
478.3
https://www.experianlc.com/responsibility/data-and-assurance/
2021
4.5
89.0
26.9
2020
3.0
25.5
28.5
493.4
398.3
521.9
2020
5.5
100.8
29.9
Governance
2019
3.6
29.8
33.4
495.3
412.6
528.7
2019
6.9
108.8
31.0
Policies & Data tables
2018
3.9
33.0
36.9
2018
8.0
experian
2017
4.4
37.0
31.4
2017
8.9
2016
4.4
38.0
42.4
Appendix
2016
9.3
TM
2015
4.8
40.9
45.7
Location-based carbon emissions. We have calculated location-based Scope 2 emissions using the International Energy Agency (IEA) carbon emission factors for electricity.
1 The Scope 3 categories that make up our Scope 3 science-based target
2 The 2018 intensity metric based on revenue has been restated following the adoption of IFRS 15. See note 3 to the Group financial statements on page 118 of the Annual Report 2019 for further detail. Metric reported in our 2018 Annual Report:
10.8 Kilograms of CO₂e per US$1,000.
85
O Experian Public
2015
9.5View entire presentation