Amplitude Results Presentation Deck
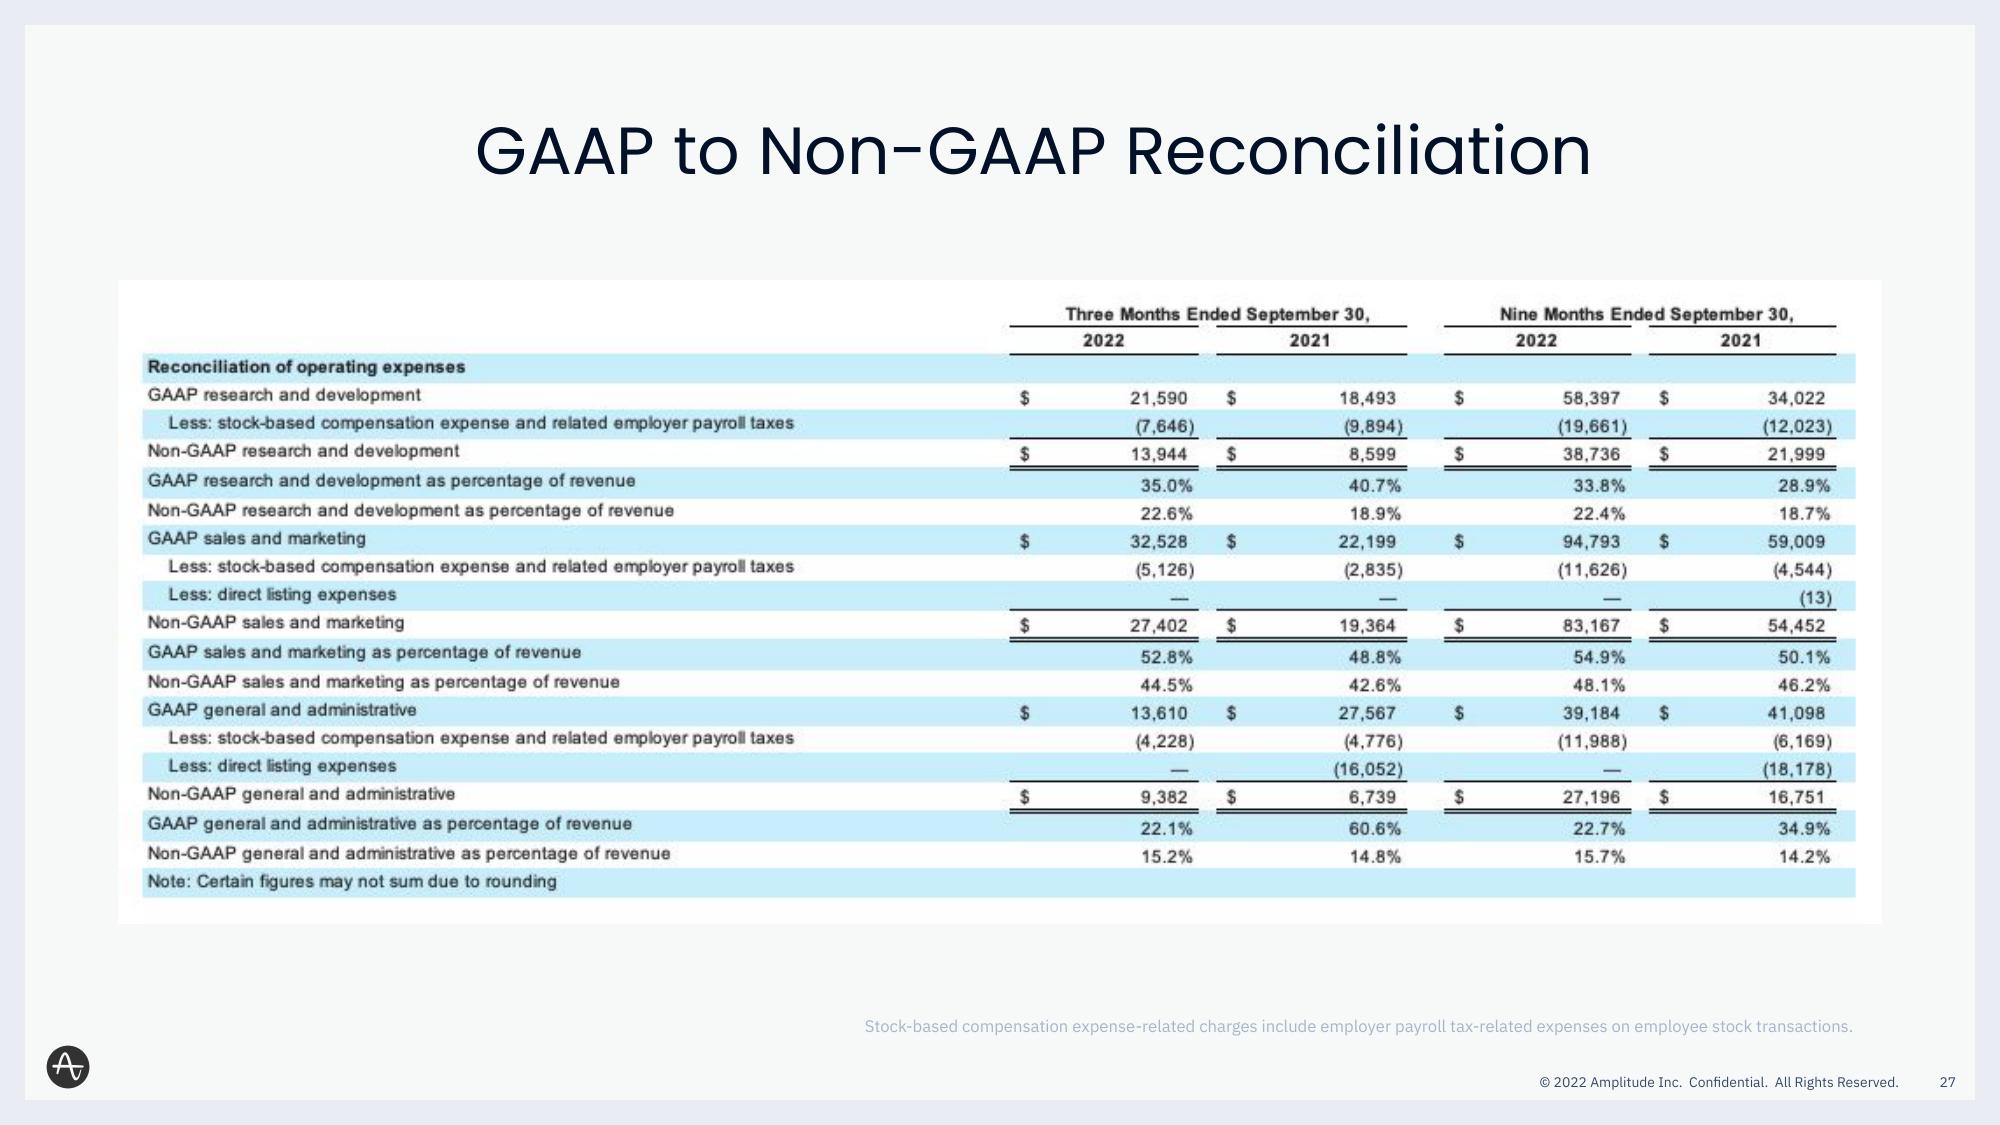
GAAP to Non-GAAP Reconciliation
Reconciliation of operating expenses
GAAP research and development
Less: stock-based compensation expense and related employer payroll taxes
Non-GAAP research and development
GAAP research and development as percentage of revenue
Non-GAAP research and development as percentage of revenue
GAAP sales and marketing
Less: stock-based compensation expense and related employer payroll taxes
Less: direct listing expenses
Non-GAAP sales and marketing
GAAP sales and marketing as percentage of revenue
Non-GAAP sales and marketing as percentage of revenue
GAAP general and administrative
Less: stock-based compensation expense and related employer payroll taxes
Less: direct listing expenses
Non-GAAP general and administrative
GAAP general and administrative as percentage of revenue
Non-GAAP general and administrative as percentage of revenue
Note: Certain figures may not sum due to rounding
$
$
$
$
Three Months Ended September 30,
2022
2021
21,590 $
(7,646)
13,944
35.0%
22.6%
32,528 $
(5,126)
$
27,402
52.8%
44.5%
13,610 $
(4,228)
9,382
22.1%
15.2%
$
$
18,493
(9,894)
8,599
40.7%
18.9%
22,199
(2,835)
19,364
48.8%
42.6%
27,567
(4,776)
(16,052)
6,739
60.6%
14.8%
$
$
$
$
$
$
Nine Months Ended September 30,
2022
2021
58,397 $
(19,661)
38,736
33.8%
22.4%
94,793
(11,626)
83,167
54.9%
48.1%
39,184
(11,988)
27.196
22.7%
15.7%
$
$
$
$
$
34,022
(12,023)
21,999
28.9%
18.7%
59,009
(4,544)
(13)
54,452
50.1%
46.2%
41,098
(6,169)
(18,178)
16,751
34.9%
14.2%
Stock-based compensation expense-related charges include employer payroll tax-related expenses on employee stock transactions.
Ⓒ2022 Amplitude Inc. Confidential. All Rights Reserved.
27View entire presentation