Tuya Results Presentation Deck
Strong Cash Position
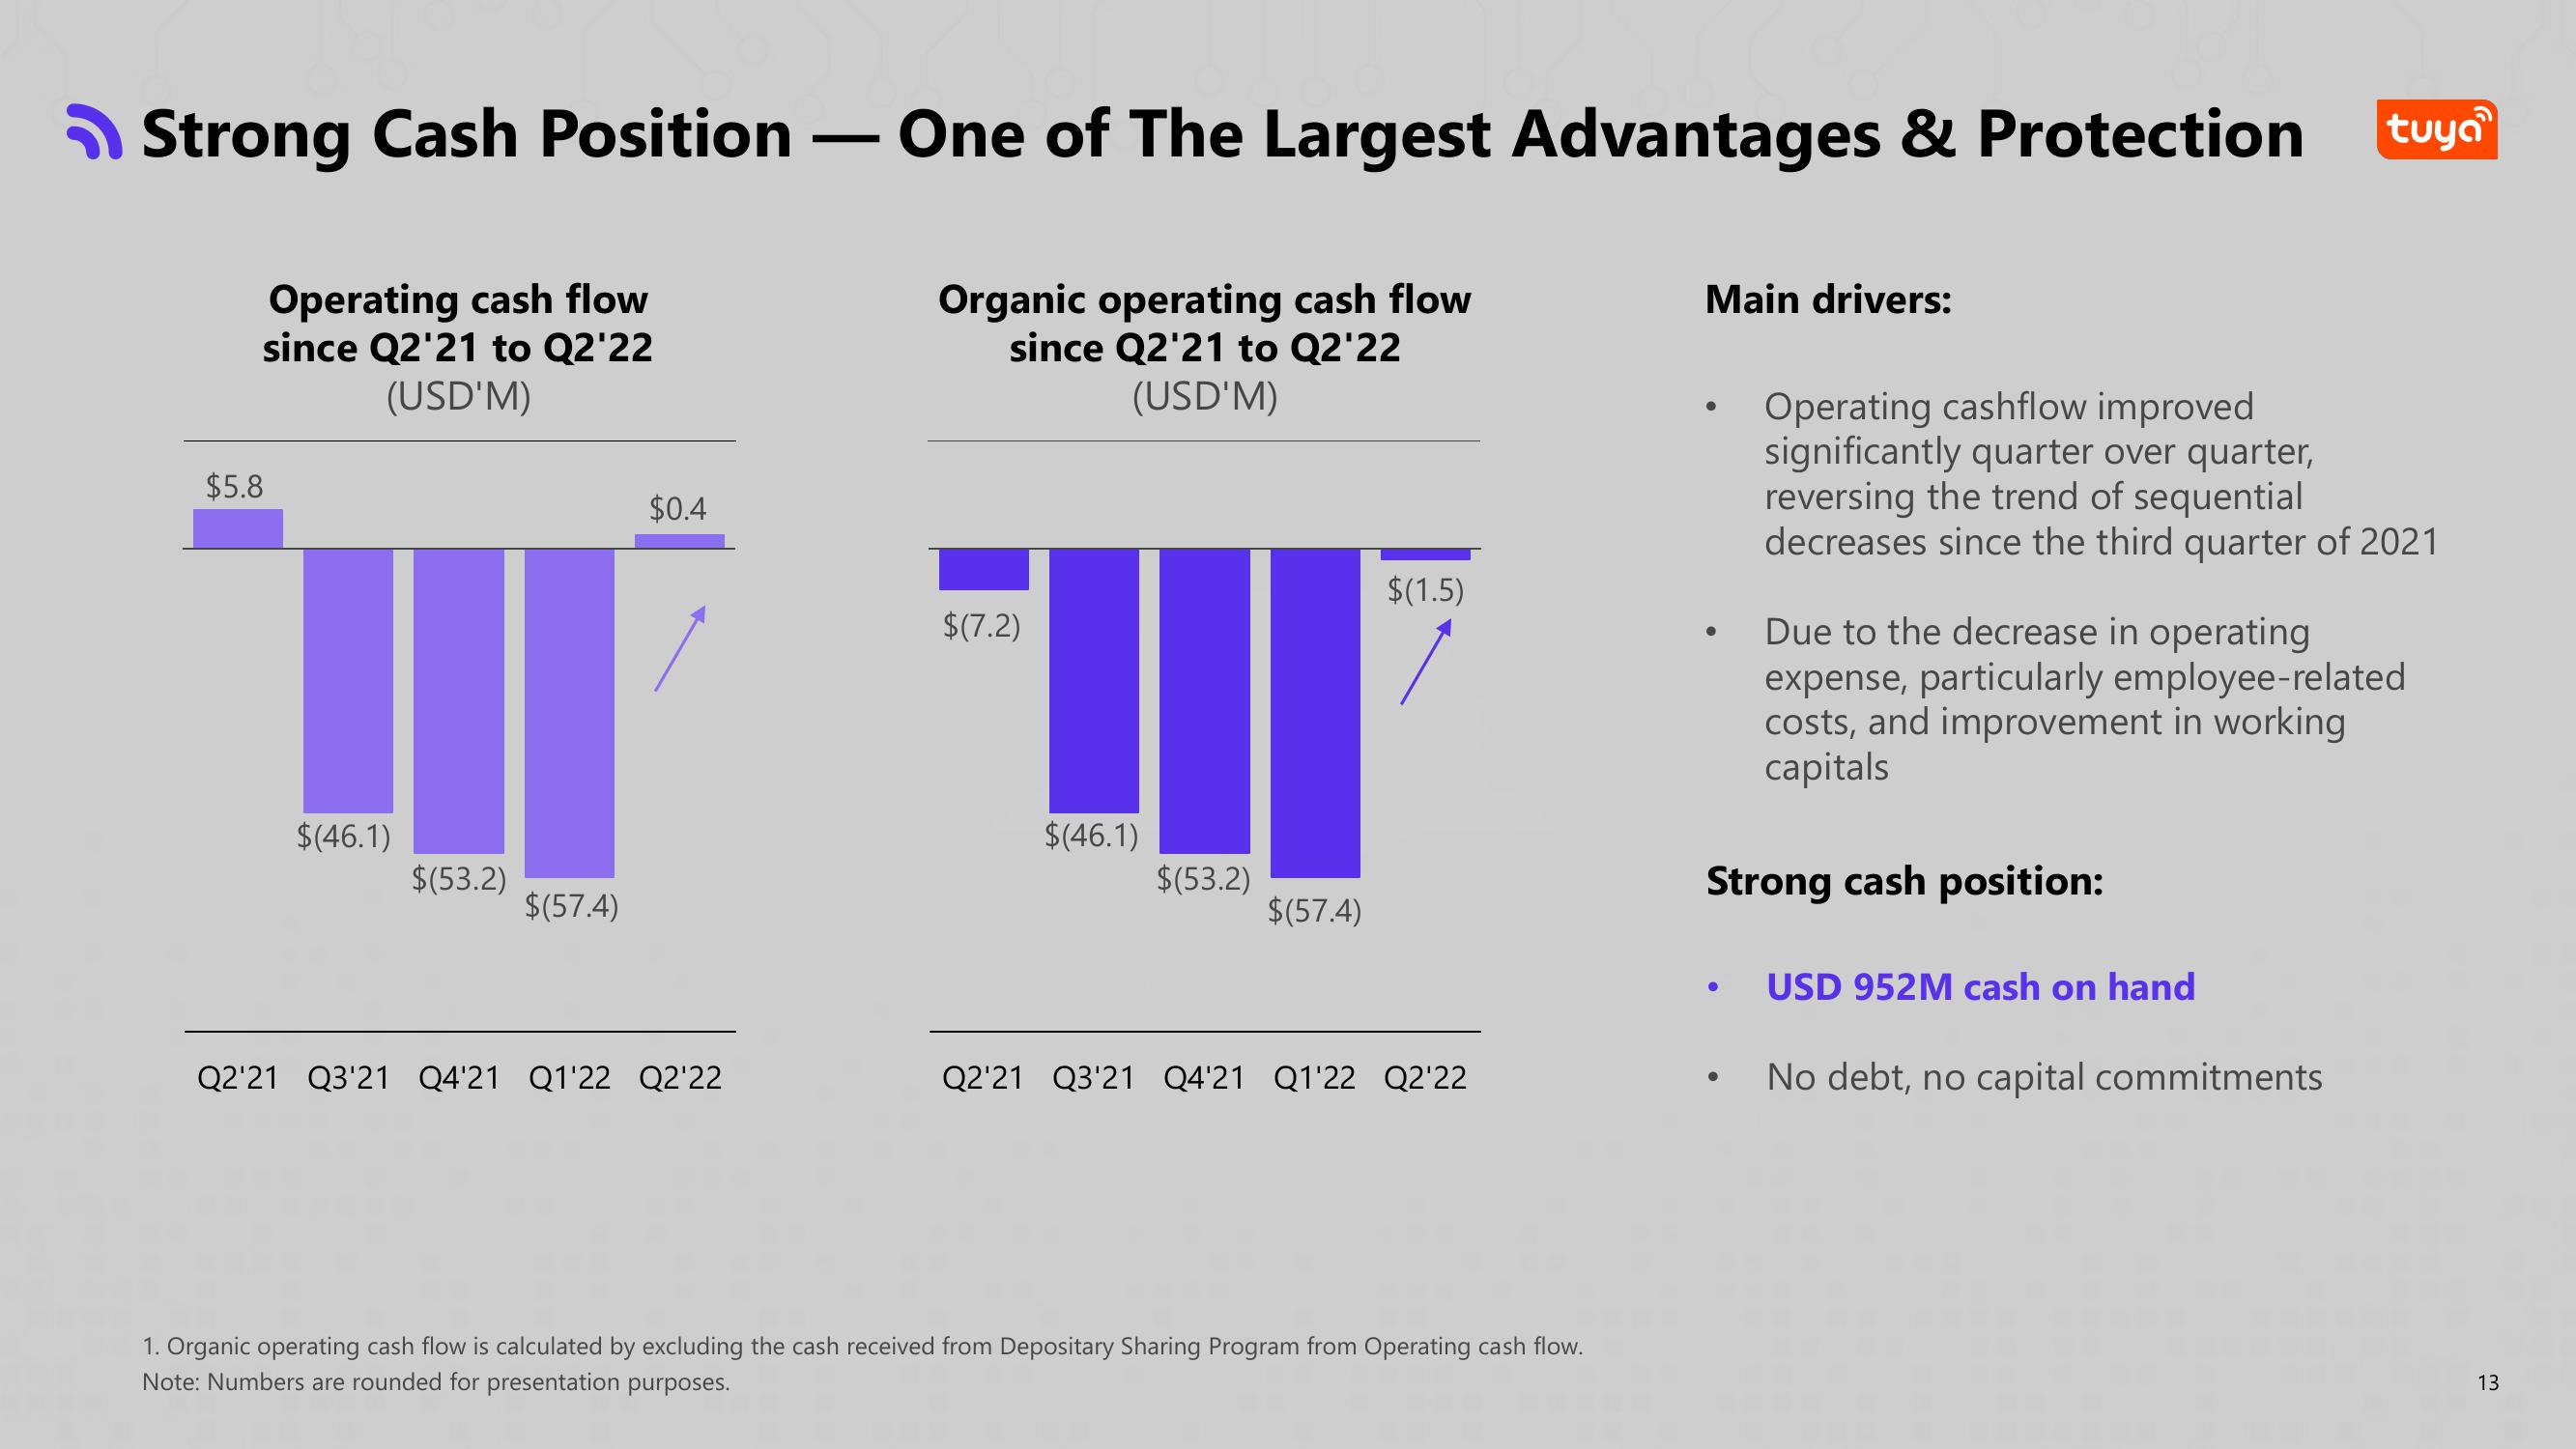
Operating cash flow
since Q2'21 to Q2'22
(USD'M)
$5.8
$(46.1)
$(53.2)
$(57.4)
$0.4
Q2'21 Q3'21 Q4'21 Q1'22 Q2'22
One of The Largest Advantages & Protection
Organic operating cash flow
since Q2'21 to Q2'22
(USD'M)
$(7.2)
$(46.1)
$(53.2)
$(57.4)
$(1.5)
Q2'21 Q3'21 Q4'21 Q1'22 Q2'22
1. Organic operating cash flow is calculated by excluding the cash received from Depositary Sharing Program from Operating cash flow.
Note: Numbers are rounded for presentation purposes.
Main drivers:
●
●
Strong cash position:
●
Operating cashflow improved
significantly quarter over quarter,
reversing the trend of sequential
decreases since the third quarter of 2021
Due to the decrease in operating
expense, particularly employee-related
costs, and improvement in working
capitals
tuya
USD 952M cash on hand
No debt, no capital commitments
13View entire presentation