Investor Presentation
At a Glance
Key Statistics
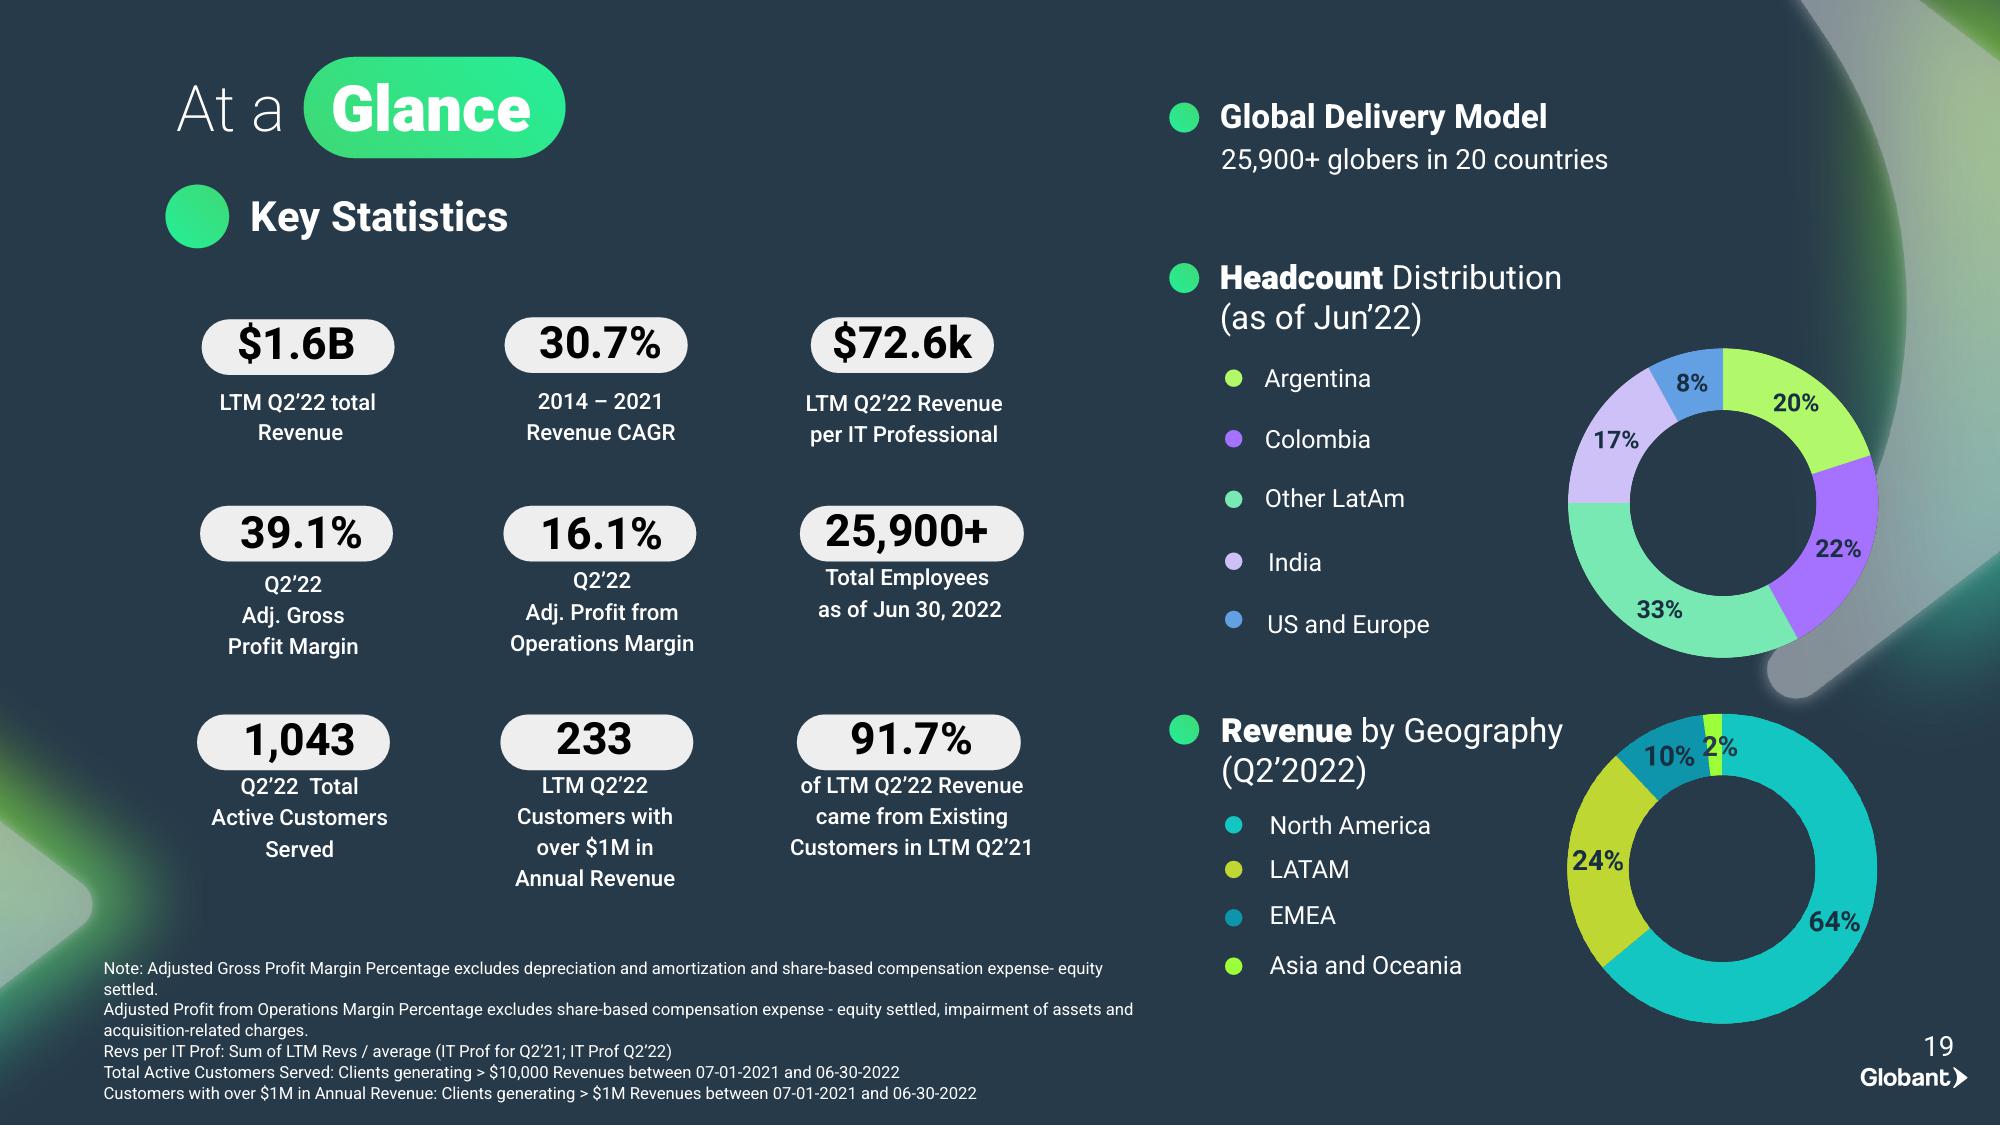
$1.6B
LTM Q2'22 total
Revenue
30.7%
2014 - 2021
Revenue CAGR
$72.6k
LTM Q2'22 Revenue
per IT Professional
39.1%
Q2'22
Adj. Gross
Profit Margin
16.1%
Q2'22
Adj. Profit from
Operations Margin
25,900+
Total Employees
as of Jun 30, 2022
1,043
Q2'22 Total
Active Customers
Served
233
LTM Q2'22
Customers with
over $1M in
Annual Revenue
Global Delivery Model
25,900+ globers in 20 countries
Headcount Distribution
(as of Jun'22)
Argentina
8%
20%
Colombia
17%
Other LatAm
India
22%
33%
US and Europe
91.7%
of LTM Q2'22 Revenue
came from Existing
Customers in LTM Q2'21
Revenue by Geography
(Q2'2022)
Note: Adjusted Gross Profit Margin Percentage excludes depreciation and amortization and share-based compensation expense- equity
settled.
Adjusted Profit from Operations Margin Percentage excludes share-based compensation expense - equity settled, impairment of assets and
acquisition-related charges.
Revs per IT Prof: Sum of LTM Revs / average (IT Prof for Q2'21; IT Prof Q2'22)
Total Active Customers Served: Clients generating > $10,000 Revenues between 07-01-2021 and 06-30-2022
Customers with over $1M in Annual Revenue: Clients generating > $1M Revenues between 07-01-2021 and 06-30-2022
2%
10%
North America
LATAM
24%
EMEA
64%
Asia and Oceania
19
Globant➤View entire presentation