Essity Results Presentation Deck
Consumer Goods
Q2 2023 vs Q2 2022
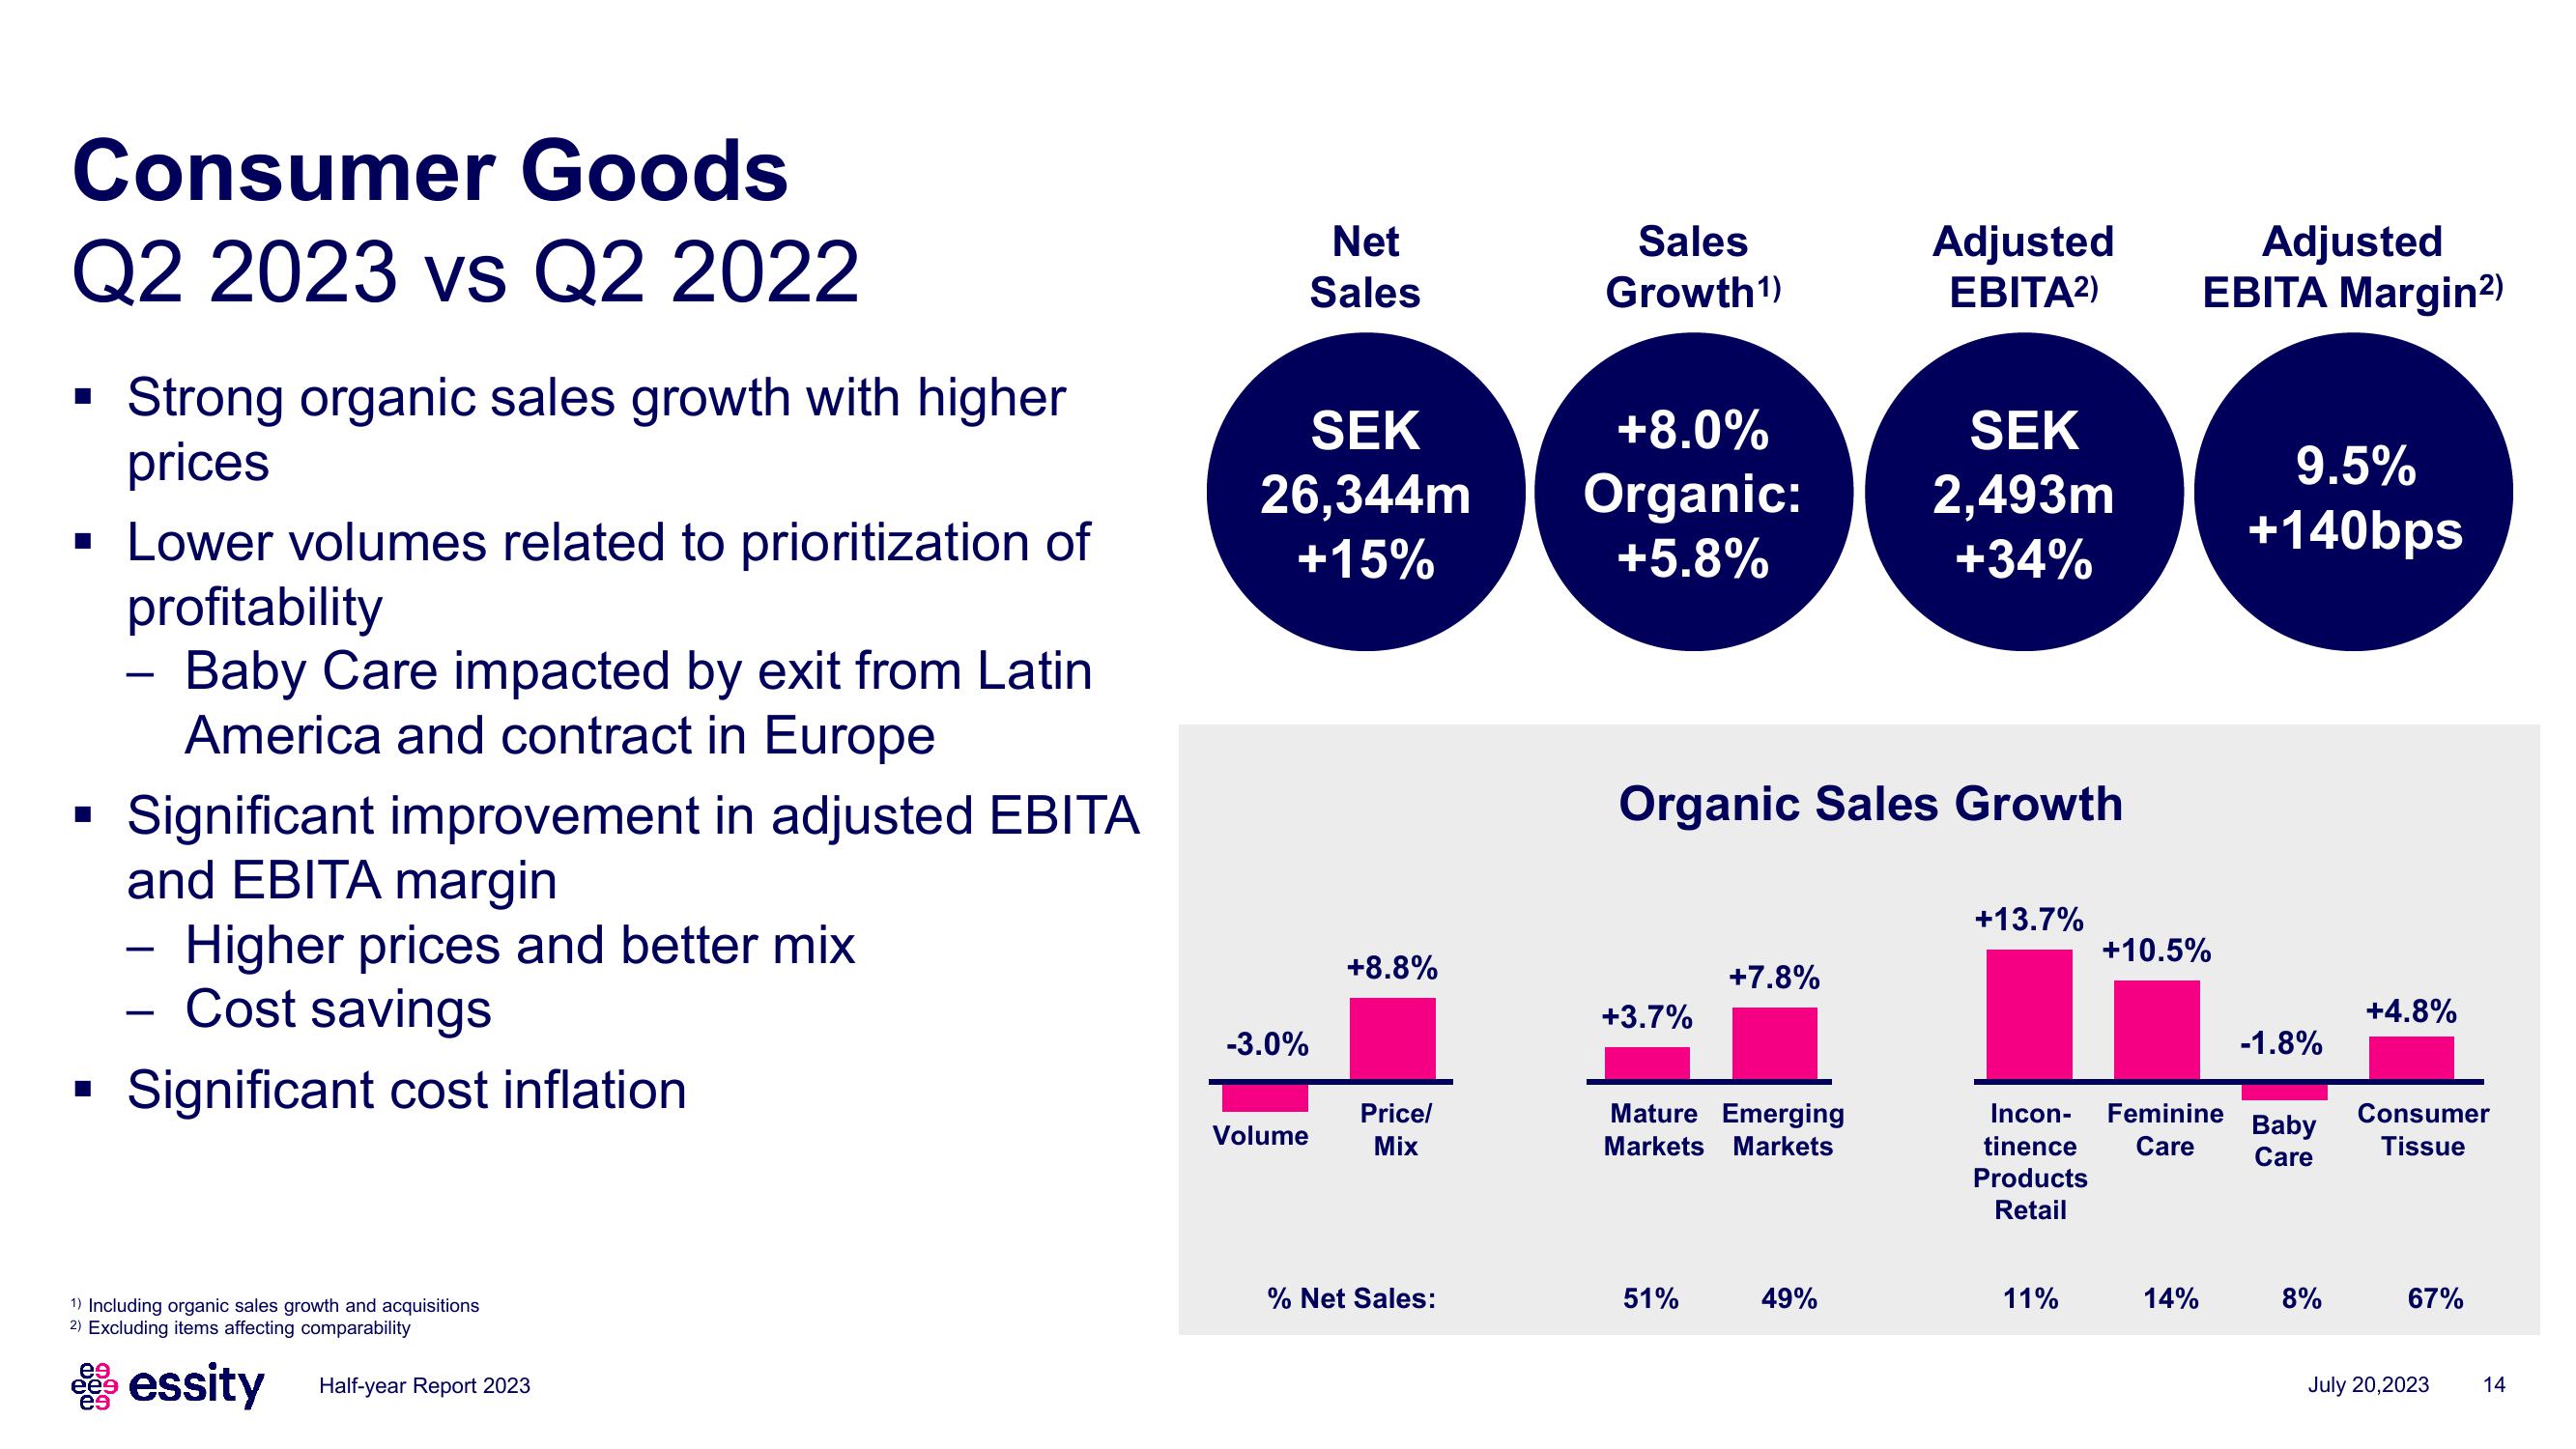
Strong organic sales growth with higher
prices
Lower volumes related to prioritization of
profitability
Baby Care impacted by exit from Latin
America and contract in Europe
Significant improvement in adjusted EBITA
and EBITA margin
Higher prices and better mix
Cost savings
▪ Significant cost inflation
■
■
■
-
e9
ee9
es
-
1) Including organic sales growth and acquisitions
2) Excluding items affecting comparability
essity Half-year Report 2023
SEK
26,344m
+15%
-3.0%
Net
Sales
Volume
+8.8%
Price/
Mix
% Net Sales:
Sales
Growth¹)
+8.0%
Organic:
+5.8%
+3.7%
Organic Sales Growth
+7.8%
Mature Emerging
Markets Markets
51%
Adjusted
EBITA²)
49%
SEK
2,493m
+34%
+13.7%
11%
Adjusted
EBITA Margin²)
+10.5%
Incon- Feminine
tinence Care
Products
Retail
14%
9.5%
+140bps
-1.8%
Baby
Care
8%
+4.8%
Consumer
Tissue
67%
July 20,2023
14View entire presentation