Maersk Investor Presentation Deck
Terminals & Towage - highlights Q3 2020
Stable earnings and cash contribution from JV's and Associates
●
●
●
19
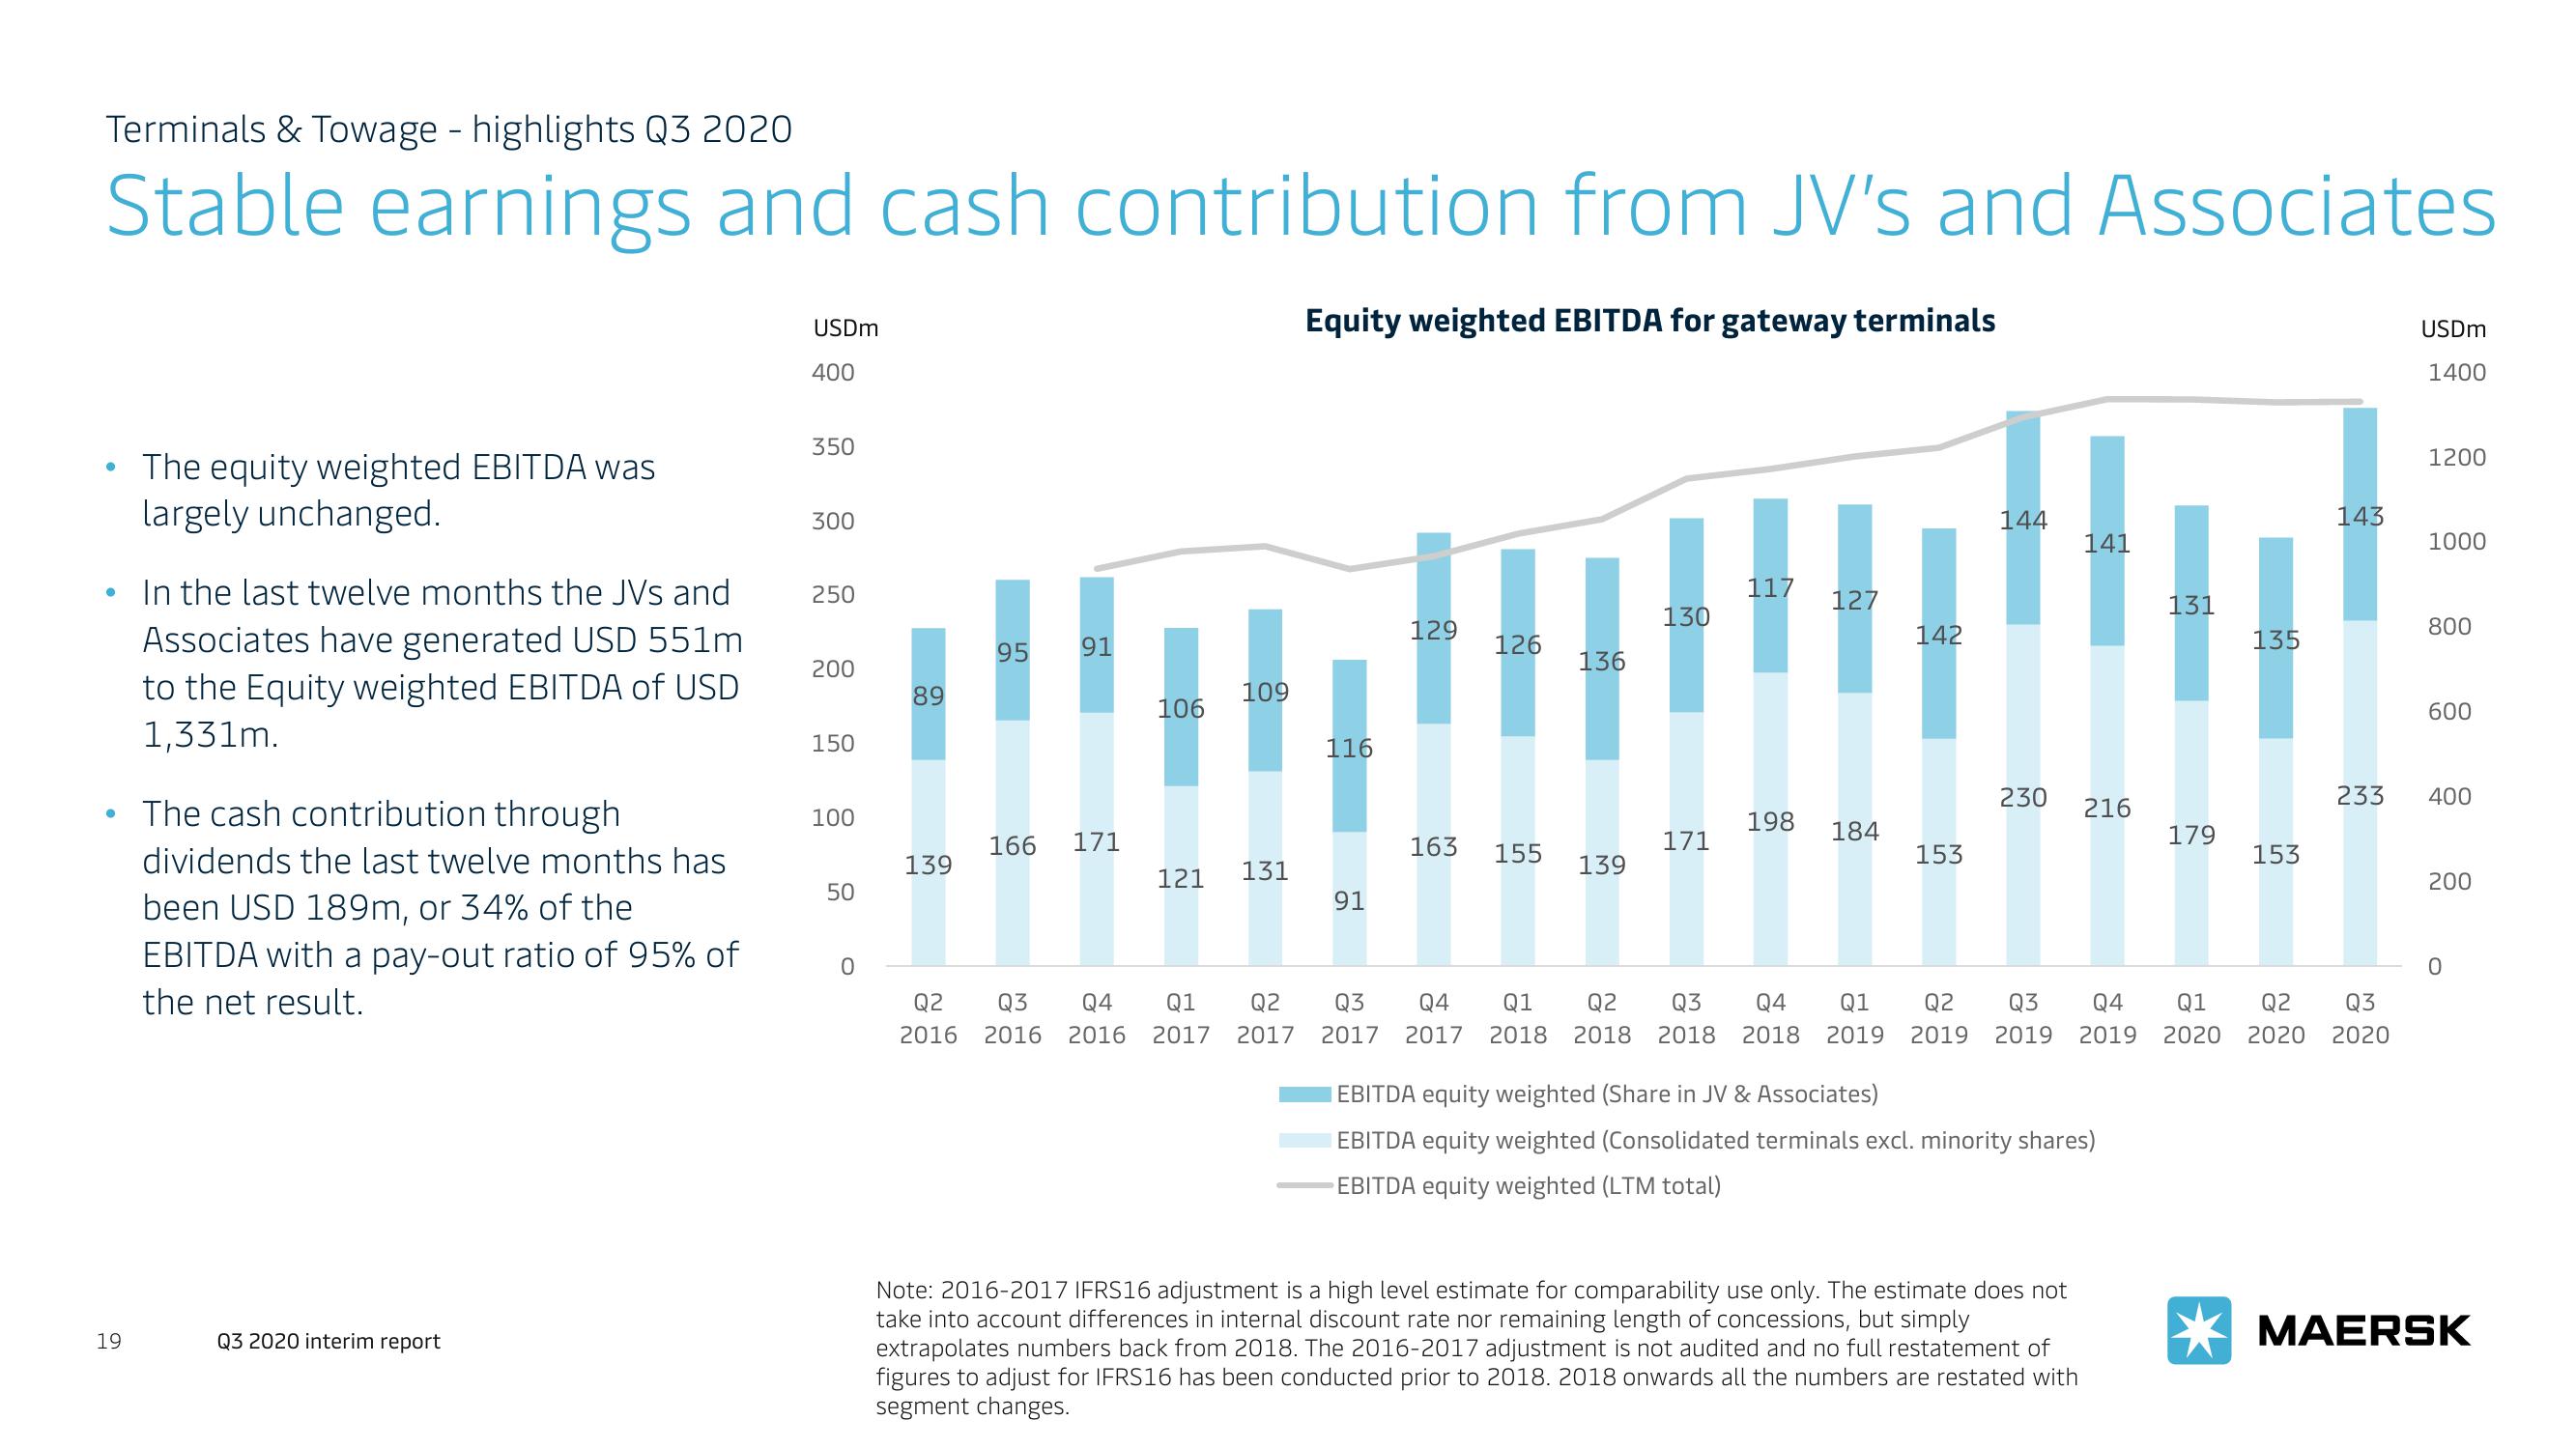
The equity weighted EBITDA was
largely unchanged.
In the last twelve months the JVs and
Associates have generated USD 551m
to the Equity weighted EBITDA of USD
1,331m.
The cash contribution through
dividends the last twelve months has
been USD 189m, or 34% of the
EBITDA with a pay-out ratio of 95% of
the net result.
Q3 2020 interim report
USDm
400
350
300
250
200
150
100
50
0
89
139
95 91
166 171
106
121
109
131
Q2 Q3 Q4 Q1 Q2
2016 2016 2016 2017 2017
Equity weighted EBITDA for gateway terminals
116
91
129
163
126
155
136
139
130
171
117
198
127
184
142
153
144
230
141
216
Note: 2016-2017 IFRS16 adjustment is a high level estimate for comparability use only. The estimate does not
take into account differences in internal discount rate nor remaining length of concessions, but simply
extrapolates numbers back from 2018. The 2016-2017 adjustment is not audited and no full restatement of
figures to adjust for IFRS16 has been conducted prior to 2018. 2018 onwards all the numbers are restated with
segment changes.
EBITDA equity weighted (Share in JV & Associates)
EBITDA equity weighted (Consolidated terminals excl. minority shares)
EBITDA equity weighted (LTM total)
131
179
135
153
143
Q3 Q4 Q1 Q2 Q3 Q4 Q1 Q2 Q3 Q4 Q1 Q2 Q3
2017 2017 2018 2018 2018 2018 2019 2019 2019 2019 2020 2020 2020
233
USDm
1400
1200
1000
800
600
400
200
0
MAERSKView entire presentation