BigCommerce Results Presentation Deck
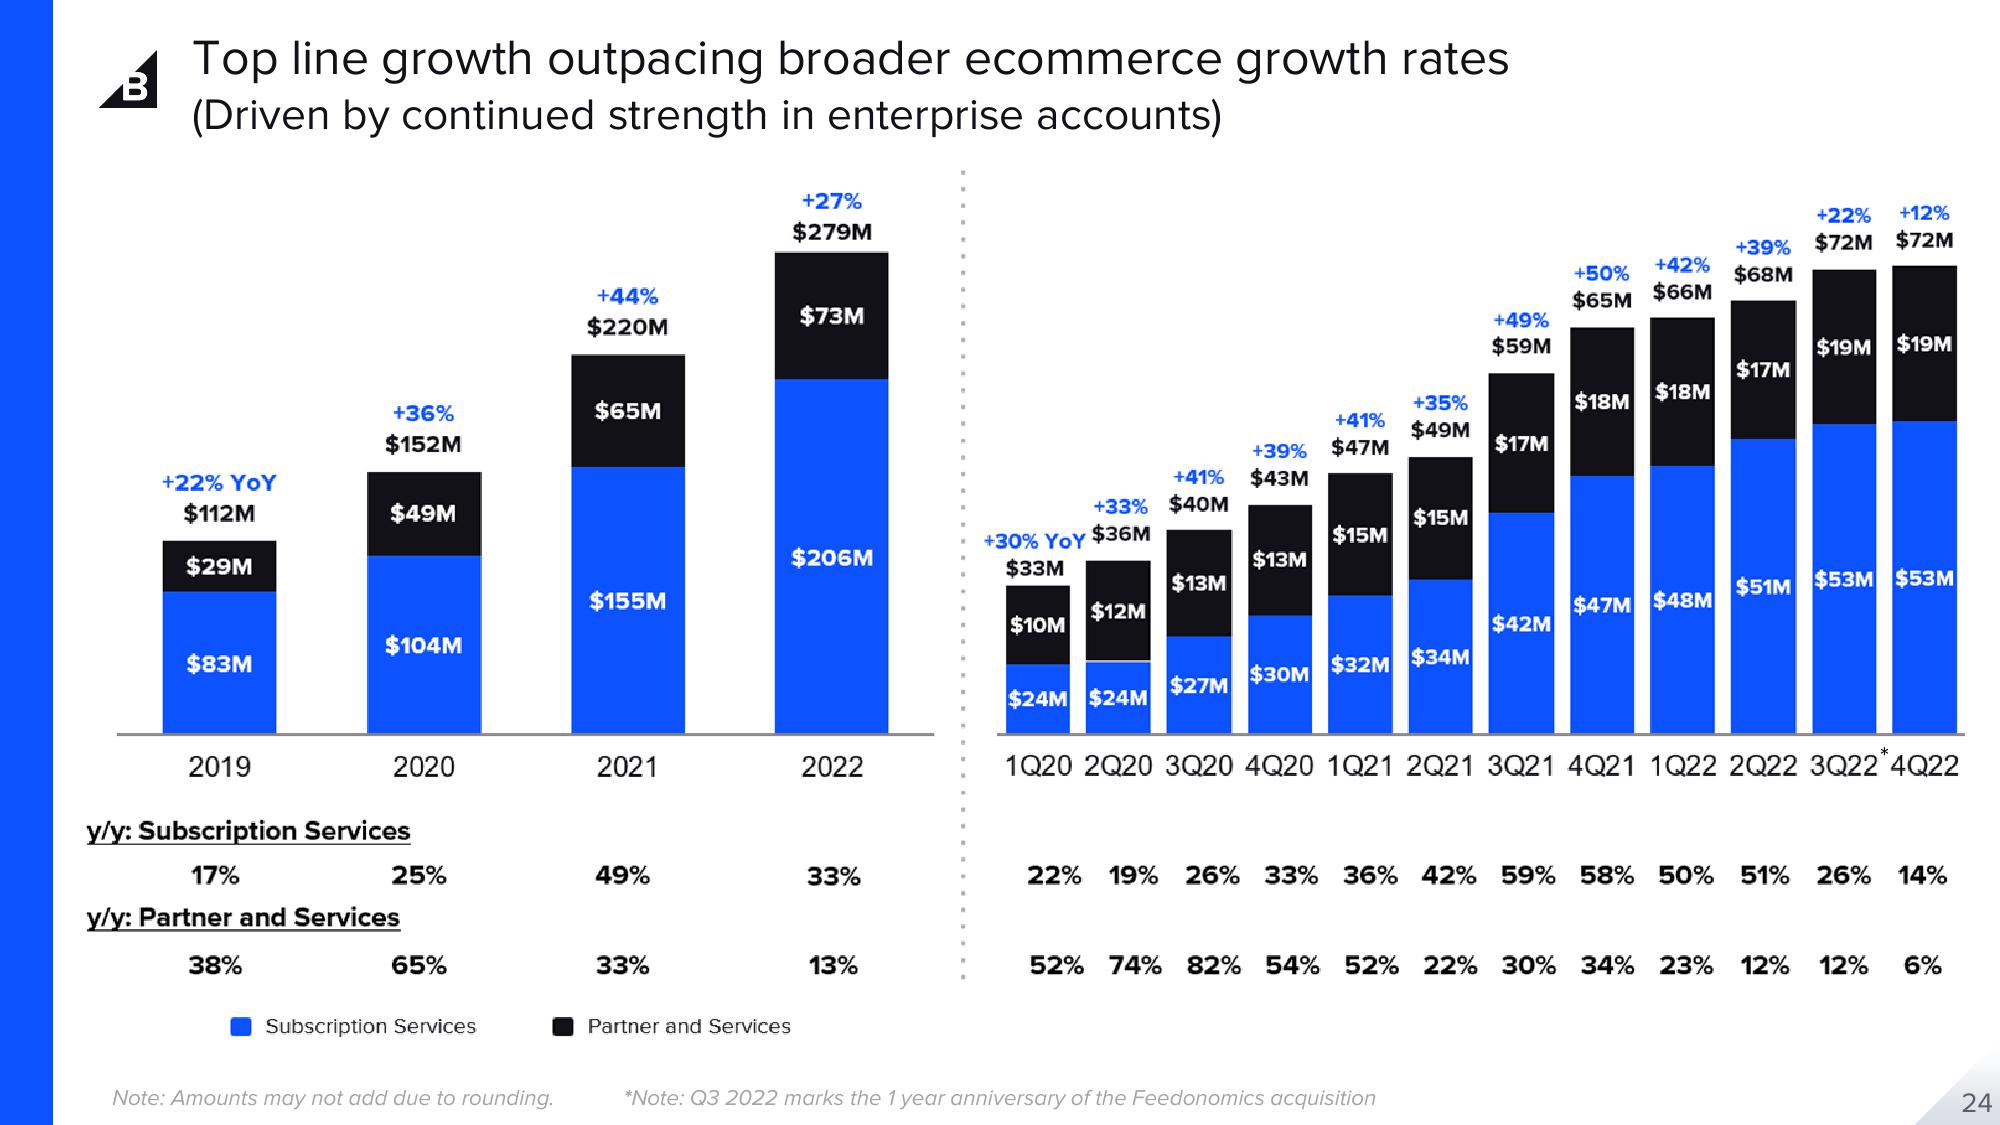
Top line growth outpacing broader ecommerce growth rates
(Driven by continued strength in enterprise accounts)
+22% YOY
$112M
$29M
$83M
2019
+36%
$152M
$49M
$104M
2020
y/y: Subscription Services
17%
y/y: Partner and Services
38%
25%
65%
Subscription Services
Note: Amounts may not add due to rounding.
+44%
$220M
$65M
$155M
2021
49%
33%
Partner and Services
+27%
$279M
$73M
$206M
2022
33%
13%
+30% YOY $36M
$33M
$10M
+33% $40M
$12M
+39% $47M
+41% $43M
$13M
$27M
$13M
+35%
+41% $49M
$30M
$15M
$15M
$32M $34M
+49%
$59M
$17M
*Note: Q3 2022 marks the 1 year anniversary of the Feedonomics acquisition
$42M
+42%
+50%
$66M
$65M
$18M
$18M
$47M $48M
+22% +12%
+39% $72M $72M
$68M
$17M
$19M $19M
$51M $53M $53M
$24M 524M
1Q20 2Q20 3Q20 4Q20 1021 2021 3Q21 4Q21 1Q22 2Q22 3Q22*4Q22
2% 19% 26% 33% 36% 42% 59% 58% 50% 51% 26% 14%
52% 74% 82% 54% 52% 22% 30% 34% 23% 12% 12% 6%
24View entire presentation