Pershing Square Activist Presentation Deck
Appendix
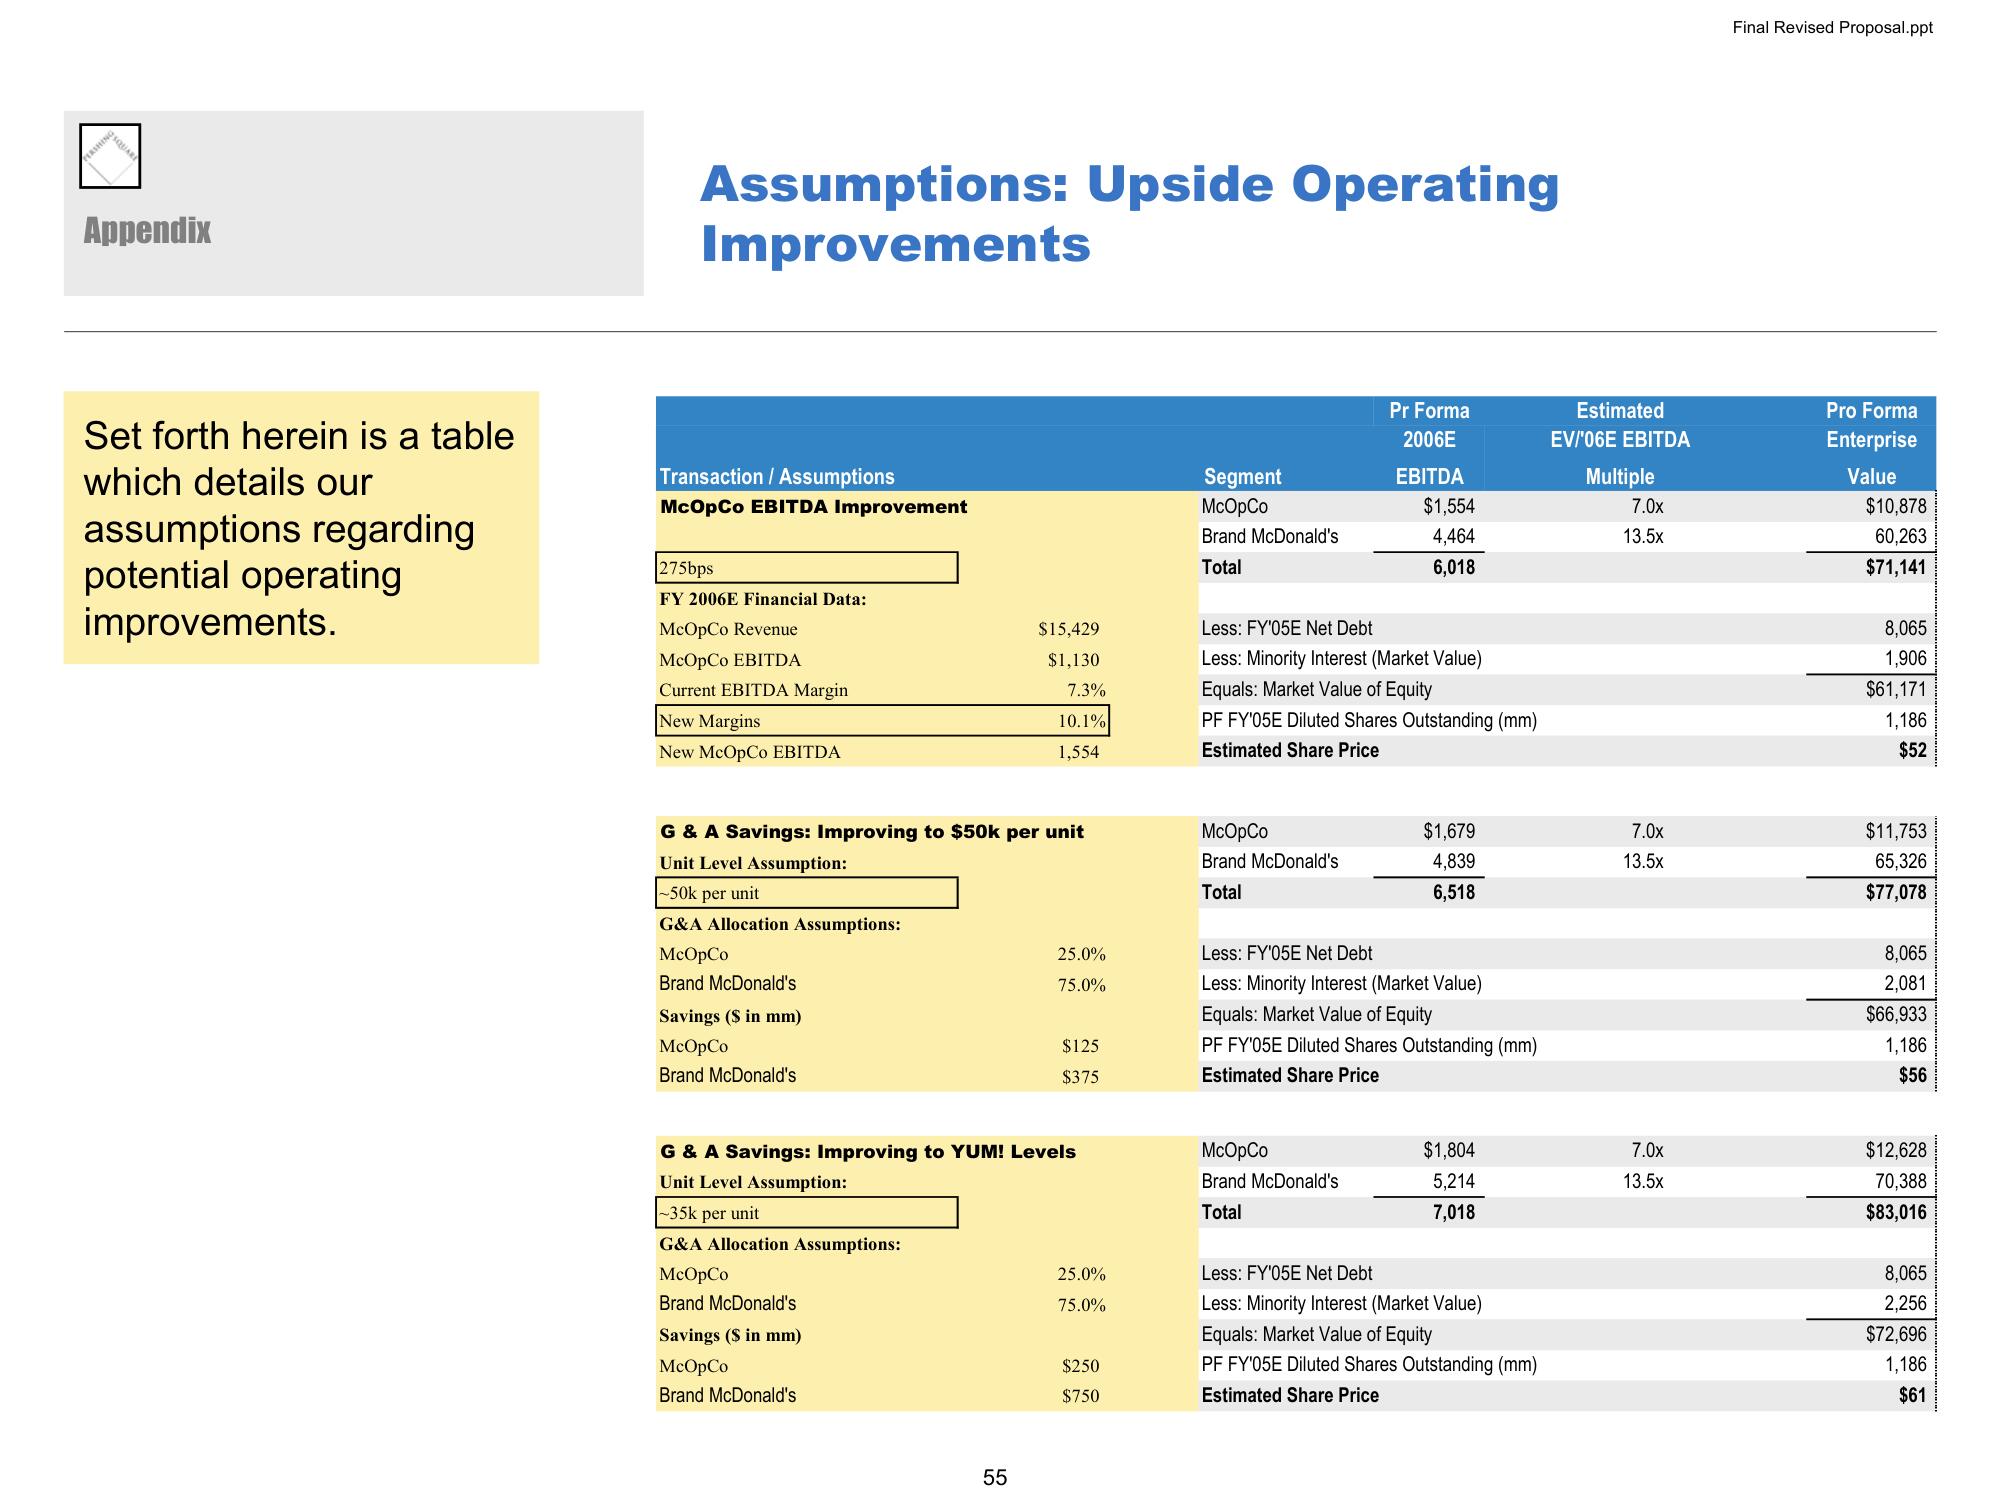
Set forth herein is a table
which details our
assumptions regarding
potential operating
improvements.
Assumptions: Upside Operating
Improvements
Transaction / Assumptions
McOpCo EBITDA Improvement
275bps
FY 2006E Financial Data:
McOpCo Revenue
McOpCo EBITDA
Current EBITDA Margin
New Margins
New McOpCo EBITDA
G & A Savings: Improving to $50k per unit
Unit Level Assumption:
-50k per unit
G&A Allocation Assumptions:
McOpCo
Brand McDonald's
Savings ($ in mm)
McOpCo
Brand McDonald's
-35k per unit
G&A Allocation Assumptions:
McOpCo
Brand McDonald's
$15,429
$1,130
7.3%
10.1%
1,554
G & A Savings: Improving to YUM! Levels
Unit Level Assumption:
Savings ($ in mm)
McOpCo
Brand McDonald's
55
25.0%
75.0%
$125
$375
25.0%
75.0%
$250
$750
Segment
McOpCo
Brand McDonald's
Total
McOpCo
Brand McDonald's
Total
Pr Forma
2006E
EBITDA
Less: FY'05E Net Debt
Less: Minority Interest (Market Value)
Equals: Market Value of Equity
PF FY'05E Diluted Shares Outstanding (mm)
Estimated Share Price
$1,554
4.464
6,018
McOpCo
Brand McDonald's
Total
$1,679
4,839
6,518
Less: FY'05E Net Debt
Less: Minority Interest (Market Value)
Equals: Market Value of Equity
PF FY'05E Diluted Shares Outstanding (mm)
Estimated Share Price
$1,804
5,214
7,018
Less: FY'05E Net Debt
Less: Minority Interest (Market Value)
Equals: Market Value of Equity
PF FY'05E Diluted Shares Outstanding (mm)
Estimated Share Price
Estimated
EV/'06E EBITDA
Multiple
7.0x
13.5x
7.0x
13.5x
7.0x
13.5x
Final Revised Proposal.ppt
Pro Forma
Enterprise
Value
$10,878
60,263
$71,141
8,065
1,906
$61,171
1,186
$52
$11,753
65,326
$77,078
8,065
2,081
$66,933
1,186
$56
$12,628
70,388
$83,016
8,065
2,256
$72,696
1,186
$61View entire presentation