Tradeweb Investor Presentation Deck
6. STRONG REVENUE AND EARNINGS GROWTH
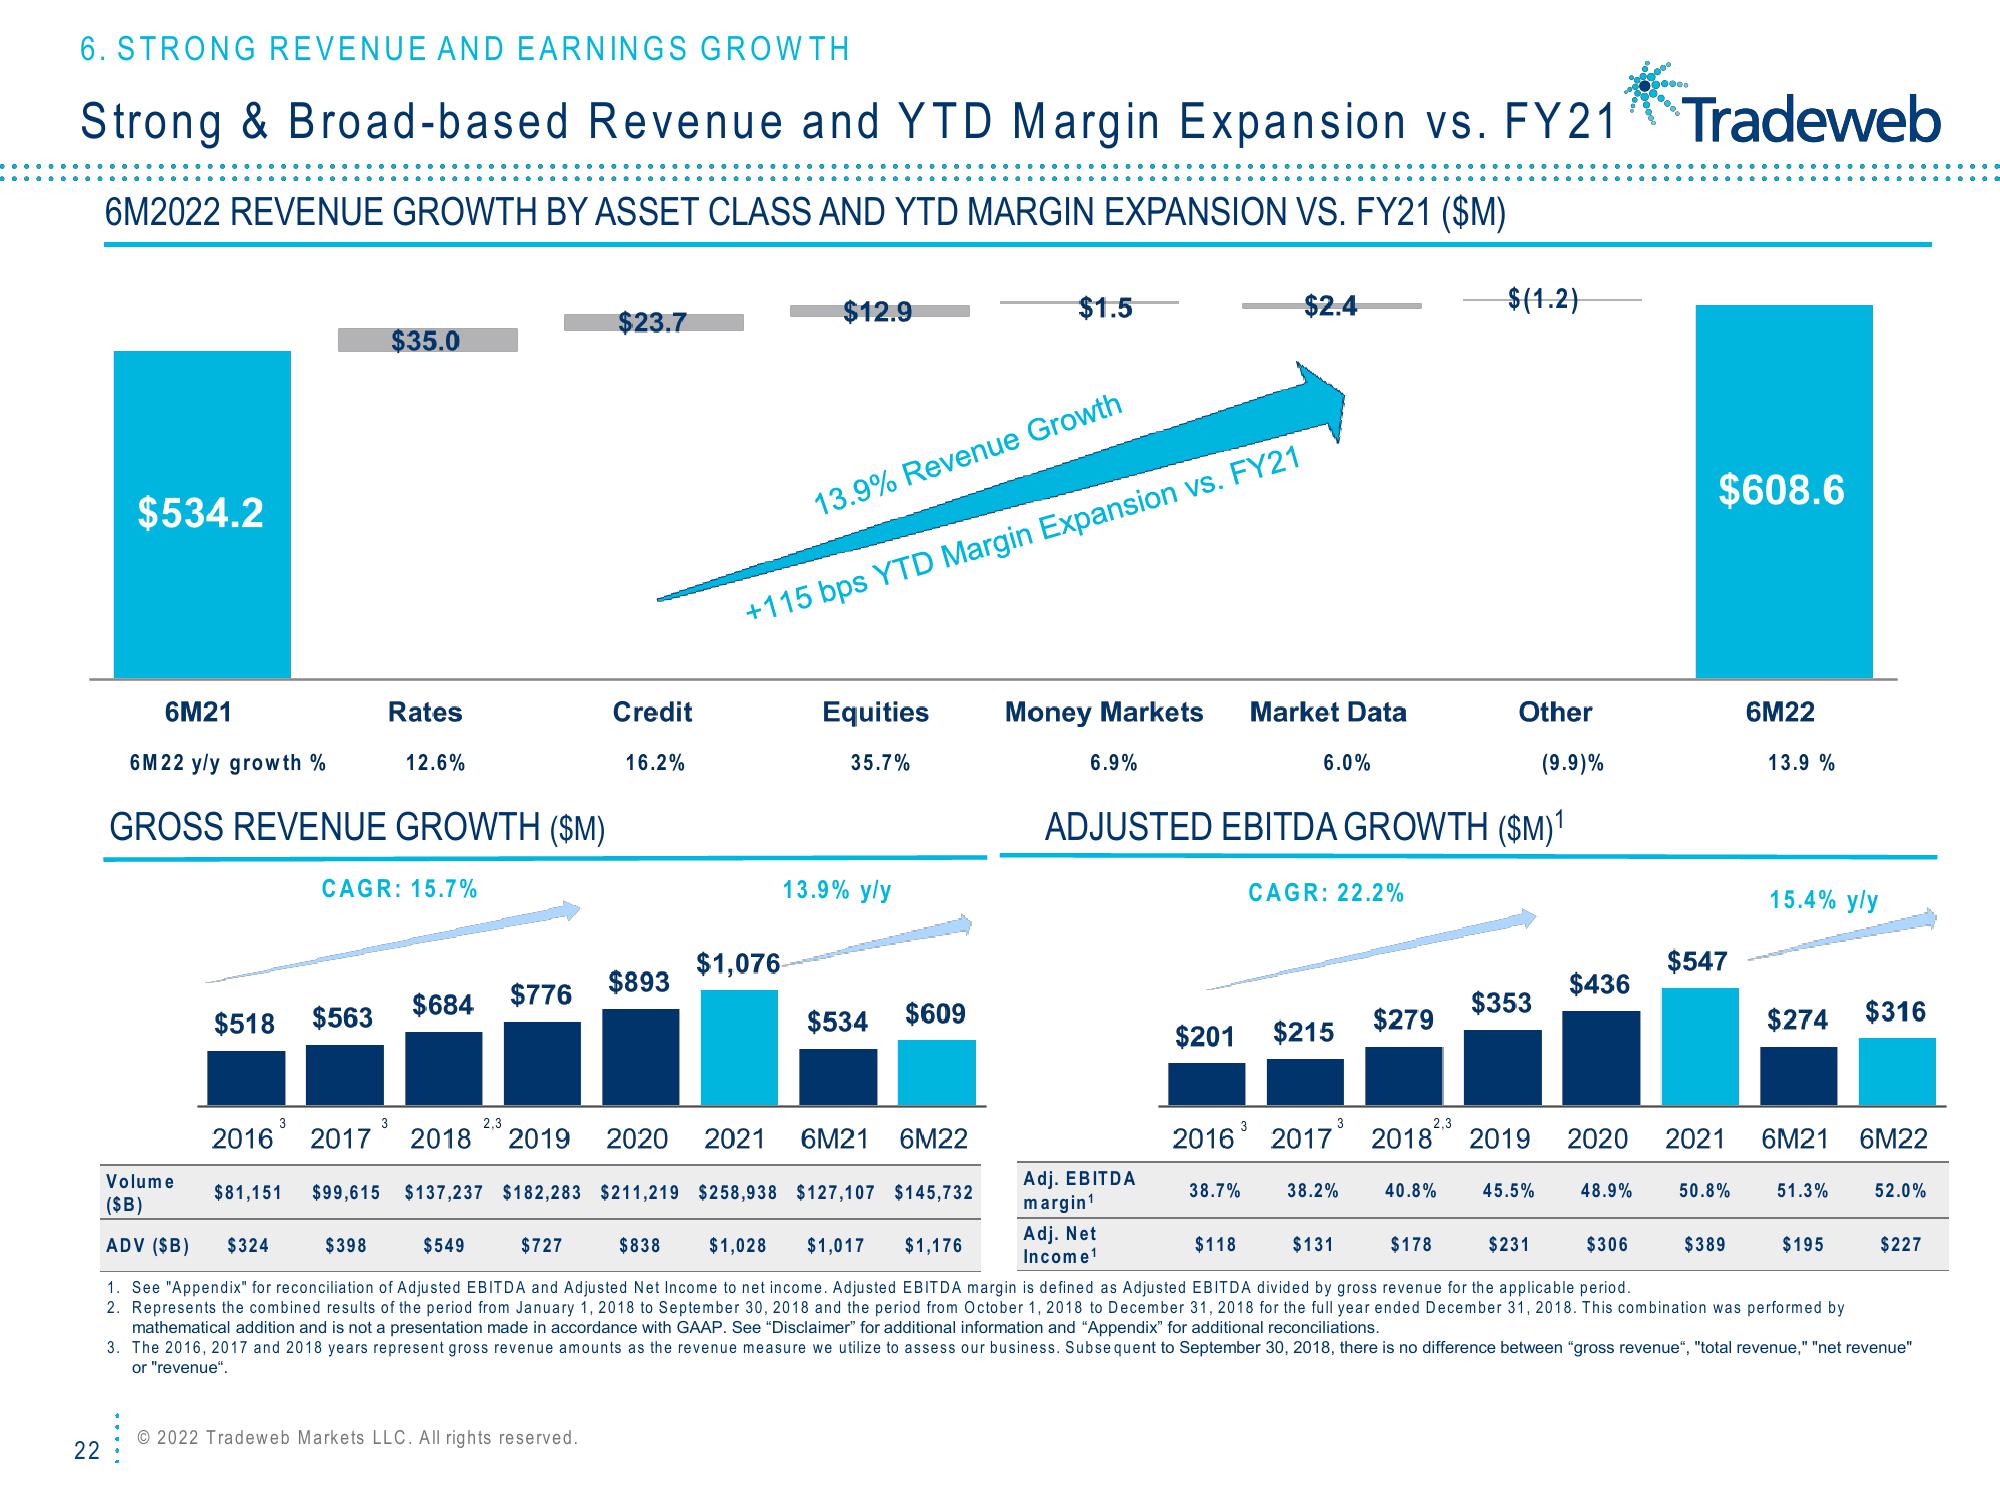
Strong & Broad-based Revenue and YTD Margin Expansion vs. FY21 Tradeweb
6M2022 REVENUE GROWTH BY ASSET CLASS AND YTD MARGIN EXPANSION VS. FY21 ($M)
22
$534.2
6M21
6M22 y/y growth %
GROSS REVENUE GROWTH ($M)
Volume
($B)
$518 $563
3
$35.0
Rates
CAGR: 15.7%
3
12.6%
$398
$684 $776
2,3
$23.7
Credit
16.2%
© 2022 Tradeweb Markets LLC. All rights reserved.
$893
2016 2017 2018 2019 2020 2021
$1,076
$12.9
13.9% Revenue Growth
+115 bps YTD Margin Expansion vs. FY21
Equities
35.7%
13.9% y/y
$534 $609
$81,151 $99,615 $137,237 $182,283 $211,219 $258,938 $127,107 $145,732
$1.5
6M21 6M22
Money Markets
6.9%
Adj. EBITDA
margin¹
Adj. Net
Income¹
$201
$2.4
Market Data
38.7%
2016³
6.0%
ADJUSTED EBITDA GROWTH ($M)¹
CAGR: 22.2%
$215
2017³
38.2%
$279
2,3
$(1.2)
Other
40.8%
$353
2018 2019
45.5%
(9.9)%
$231
$436
2020
48.9%
ooo..
$608.6
$547
50.8%
6M22
13.9%
$389
15.4% yly
2021 6M21 6M22
$274 $316
$324
$549
$727
$838 $1,028 $1,017 $1,176
$118
$131
$178
$306
ADV ($B)
1. See "Appendix" for reconciliation of Adjusted EBITDA and Adjusted Net Income to net income. Adjusted EBITDA margin is defined as Adjusted EBITDA divided by gross revenue for the applicable period.
2. Represents the combined results of the period from January 1, 2018 to September 30, 2018 and the period from October 1, 2018 to December 31, 2018 for the full year ended December 31, 2018. This combination was performed by
mathematical addition and is not a presentation made in accordance with GAAP. See "Disclaimer" for additional information and "Appendix" for additional reconciliations.
3. The 2016, 2017 and 2018 years represent gross revenue amounts as the revenue measure we utilize to assess our business. Subsequent to September 30, 2018, there is no difference between "gross revenue", "total revenue," "net revenue"
or "revenue".
51.3%
52.0%
$195
$227View entire presentation