Bed Bath & Beyond Results Presentation Deck
APPENDIX
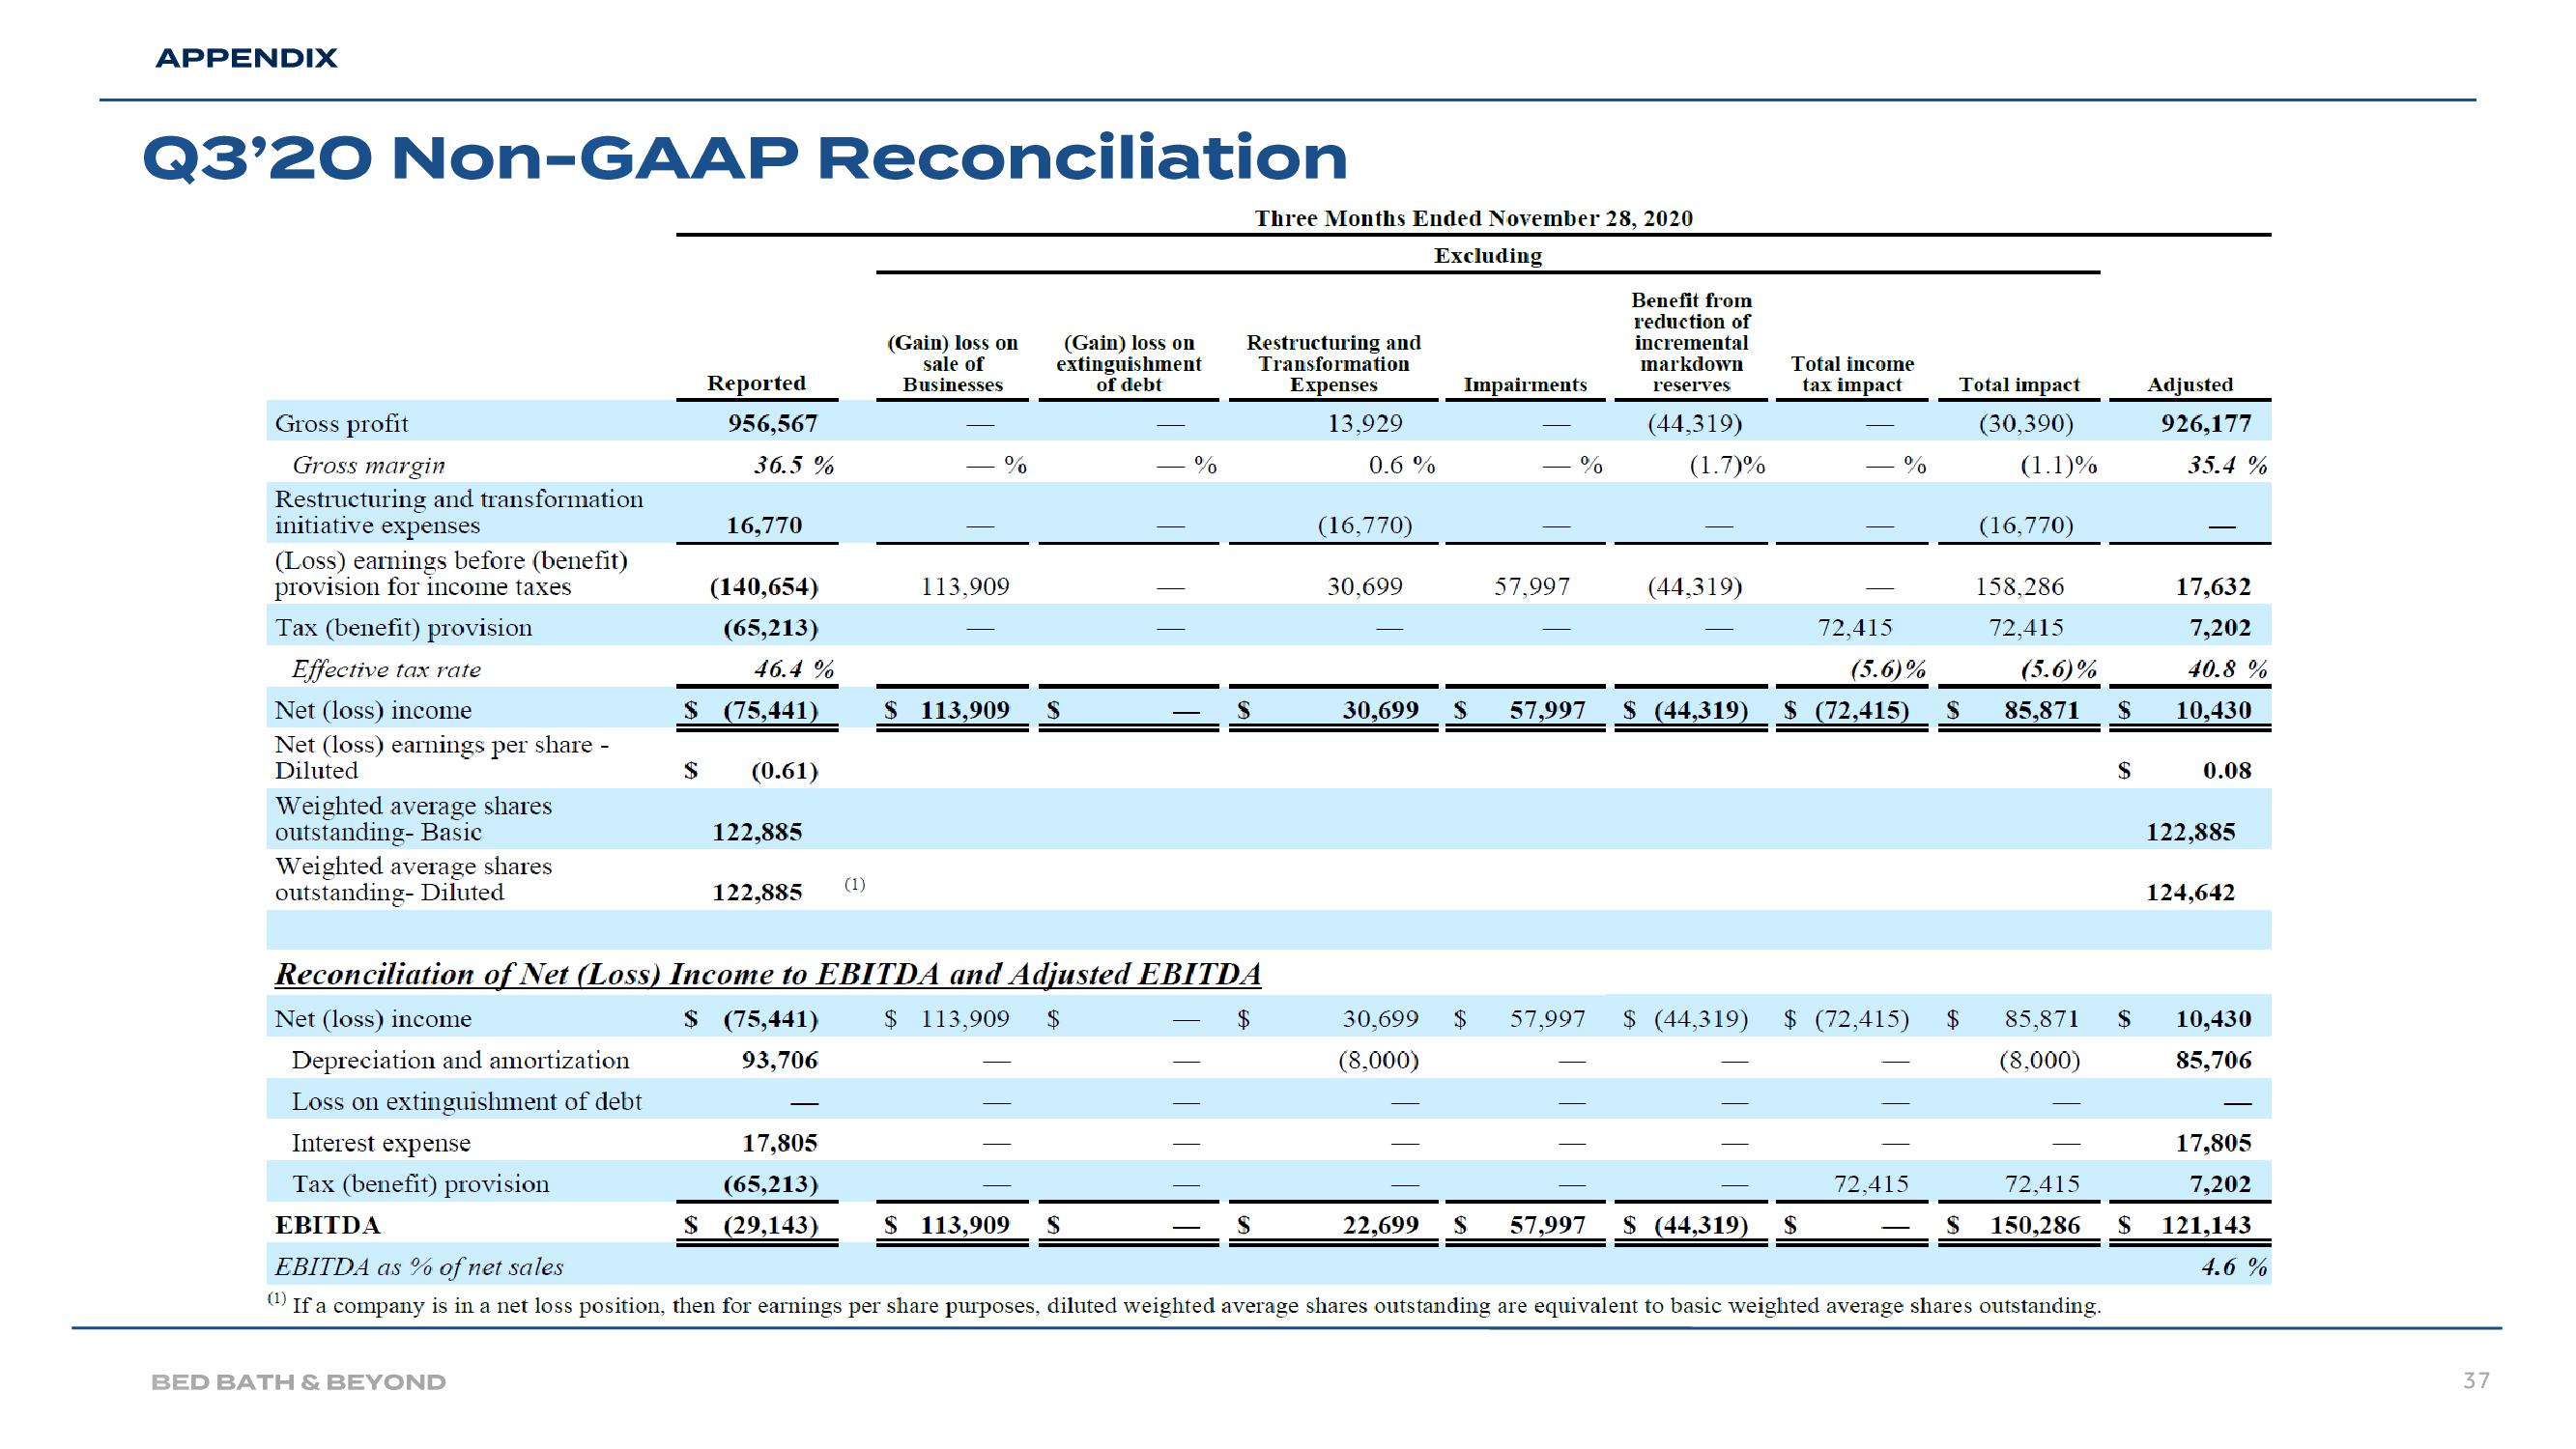
Q3'20 Non-GAAP Reconciliation
Gross profit
Gross margin
Restructuring and transformation
initiative expenses
(Loss) earnings before (benefit)
provision for income taxes
Tax (benefit) provision
Effective tax rate
Net (loss) income
Net (loss) earnings per share -
Diluted
Weighted average shares
outstanding- Basic
Weighted average shares
outstanding- Diluted
Reported
956,567
36.5 %
BED BATH & BEYOND
16,770
(140,654)
(65,213)
46.4%
$ (75,441)
$ (0.61)
122,885
122,885
$ (75,441)
93,706
(1)
(Gain) loss on
sale of
Businesses
17,805
(65,213)
$ (29,143)
113,909
(Gain) loss on
extinguishment
of debt
$ 113,909 S
%
Reconciliation of Net (Loss) Income to EBITDA and Adjusted EBITDA
$ 113,909 $
$
$ 113,909 S
Three Months Ended November 28, 2020
Restructuring and
Transformation
Expenses
13,929
S
0.6 %
(16,770)
30.699
Excluding
Impairments
30,699 S
30.699 $
(8,000)
57,997
%
57,997
Benefit from
reduction of
incremental
markdown
reserves
(44,319)
(1.7)%
(44,319)
22,699 S 57,997
Total income
tax impact
$ (44,319)
(5.6)%
57,997 $ (44,319) $ (72,415) S
72,415
%
Net (loss) income
Depreciation and amortization
Loss on extinguishment of debt
Interest expense
Tax (benefit) provision
EBITDA
EBITDA as % of net sales
If a company is in a net loss position, then for earnings per share purposes, diluted weighted average shares outstanding are equivalent to basic weighted average shares outstanding.
(1)
$ (72,415)
$ (44,319) S
Total impact
72,415
$
(30,390)
(1.1)%
(16,770)
158,286
72,415
(5.6)%
85,871 $
85,871
(8,000)
72,415
S 150,286
$
$
S
Adjusted
926,177
35.4 %
17,632
7,202
40.8 %
10,430
0.08
122,885
124,642
10,430
85,706
17,805
7,202
121,143
4.6 %
37View entire presentation