WeWork SPAC Presentation Deck
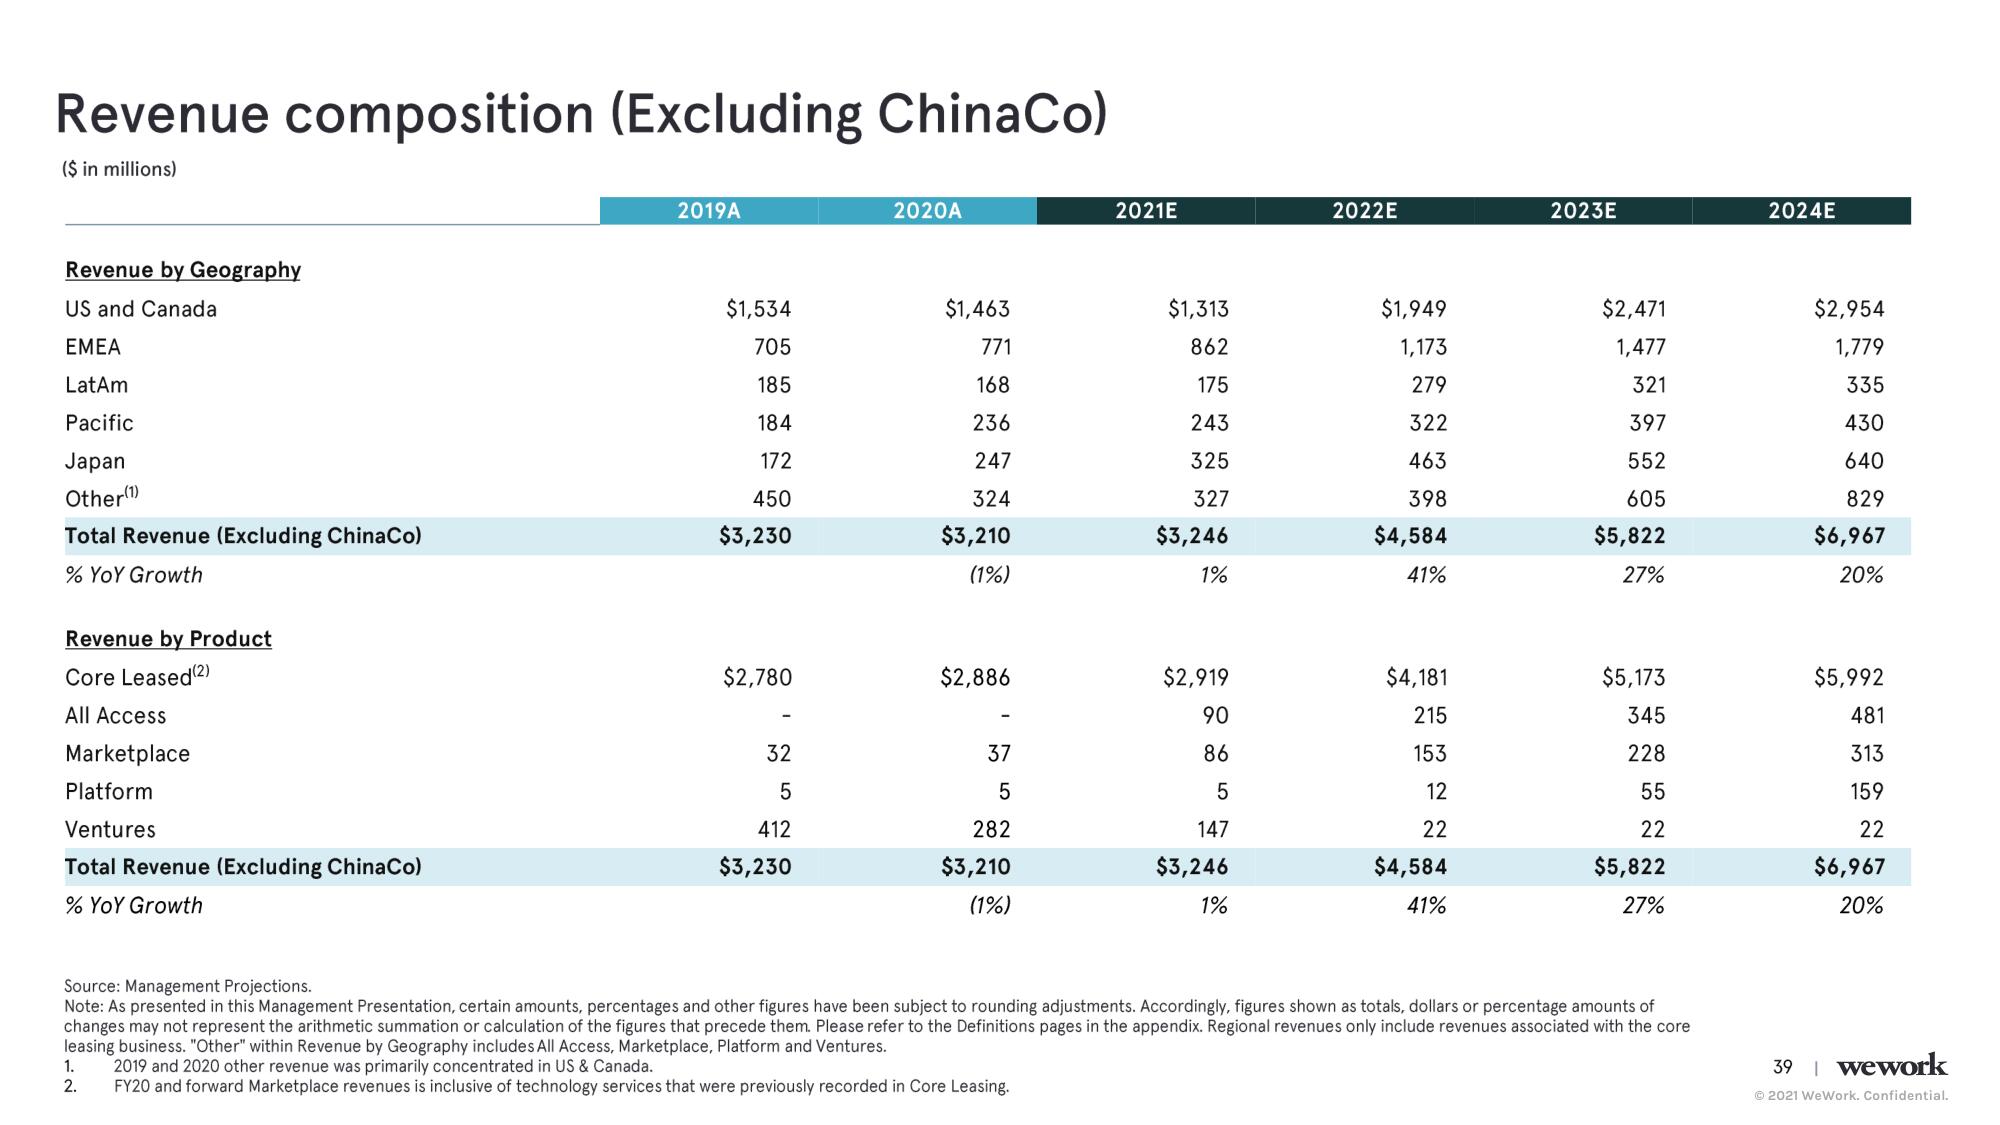
Revenue composition (Excluding ChinaCo)
($ in millions)
Revenue by Geography
US and Canada
EMEA
LatAm
Pacific
Japan
Other(1)
Total Revenue (Excluding ChinaCo)
% YoY Growth
Revenue by Product
Core Leased (2)
All Access
Marketplace
Platform
Ventures
Total Revenue (Excluding ChinaCo)
% YoY Growth
2019A
1.
2.
$1,534
705
185
184
172
450
$3,230
$2,780
32
5
412
$3,230
2020A
$1,463
771
168
236
247
324
$3,210
(1%)
$2,886
37
5
282
$3,210
(1%)
2021E
$1,313
862
175
243
325
327
$3,246
1%
$2,919
90
86
5
147
$3,246
1%
2022E
$1,949
1,173
279
322
463
398
$4,584
41%
$4,181
215
153
12
22
$4,584
41%
2023E
$2,471
1,477
321
397
552
605
$5,822
27%
$5,173
345
228
55
22
$5,822
27%
Source: Management Projections.
Note: As presented in this Management Presentation, certain amounts, percentages and other figures have been subject to rounding adjustments. Accordingly, figures shown as totals, dollars or percentage amounts of
changes may not represent the arithmetic summation or calculation of the figures that precede them. Please refer to the Definitions pages in the appendix. Regional revenues only include revenues associated with the core
leasing business. "Other" within Revenue by Geography includes All Access, Marketplace, Platform and Ventures.
2019 and 2020 other revenue was primarily concentrated in US & Canada.
FY20 and forward Marketplace revenues is inclusive of technology services that were previously recorded in Core Leasing.
2024E
$2,954
1,779
335
430
640
829
$6,967
20%
$5,992
481
313
159
22
$6,967
20%
39 wework
Ⓒ2021 WeWork. Confidential.View entire presentation