Credit Suisse Investment Banking Pitch Book
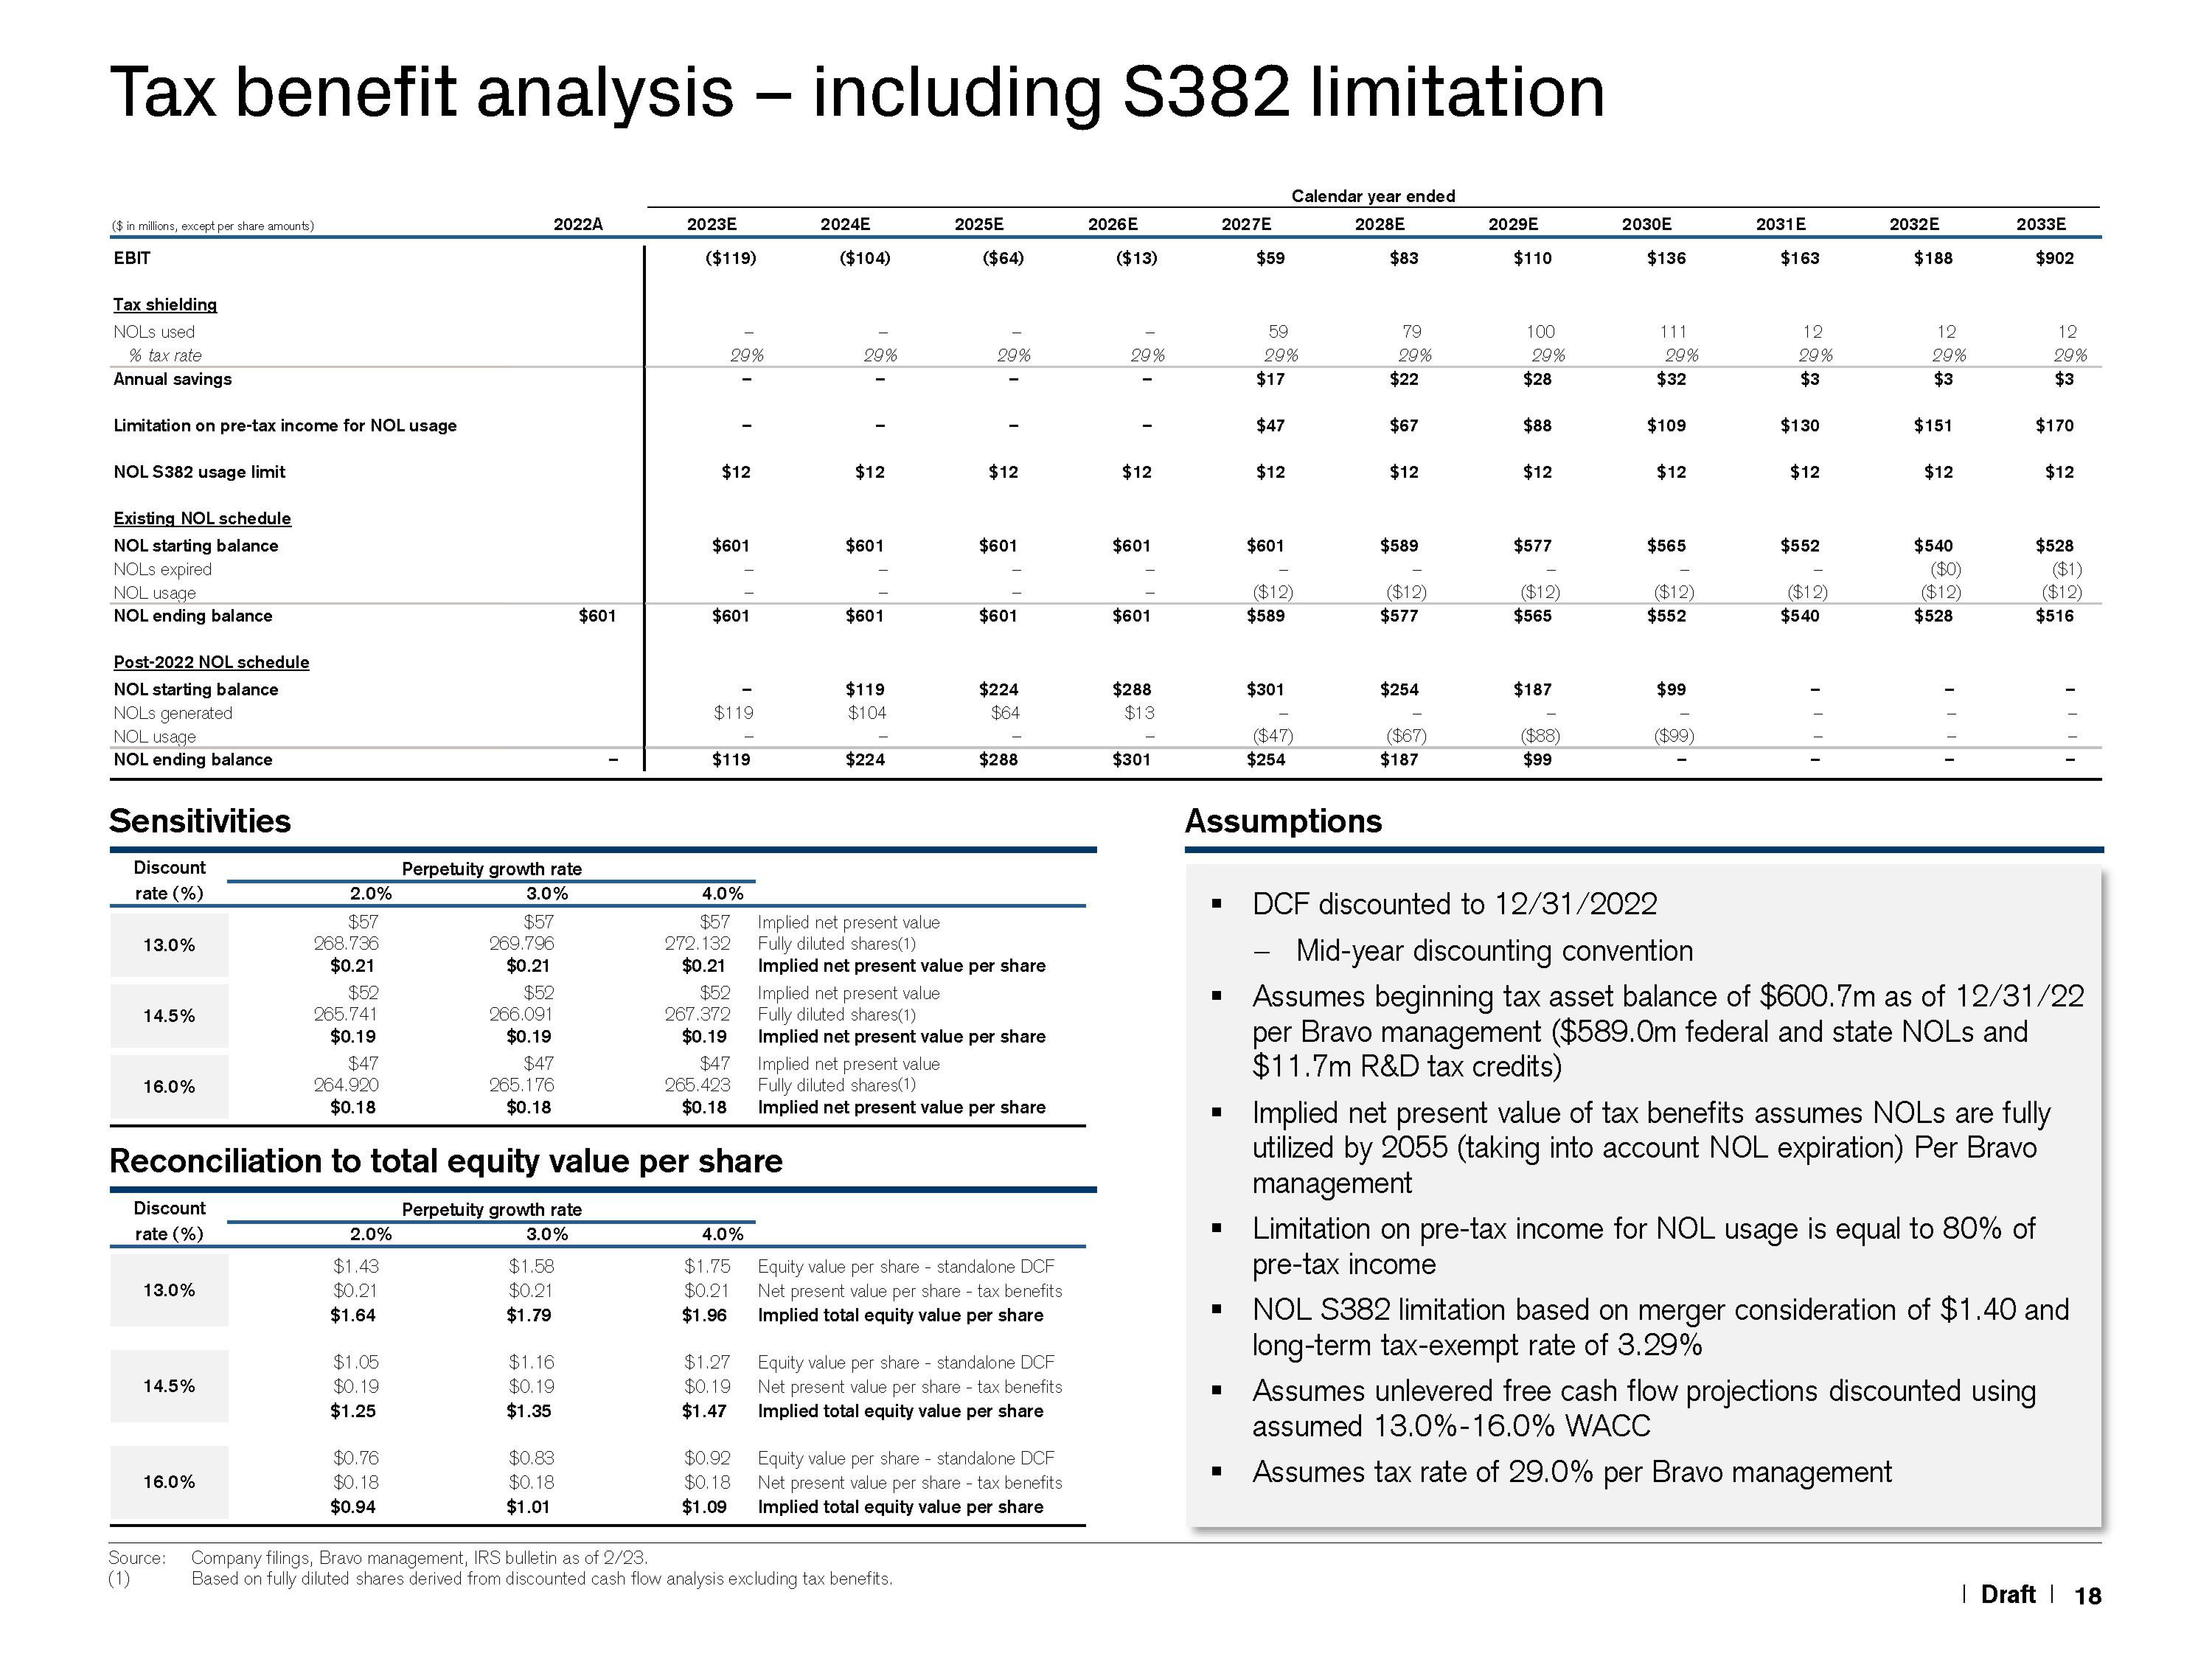
Tax benefit analysis - including S382 limitation
($ in millions, except per share amounts)
EBIT
Tax shielding
NOLS used
% tax rate
Annual savings
Limitation on pre-tax income for NOL usage
NOL S382 usage limit
Existing NOL schedule
NOL starting balance
NOLS expired
NOL usage
NOL ending balance
Post-2022 NOL schedule
NOL starting balance
NOLS generated
NOL usage
NOL ending balance
Sensitivities
Discount
rate (%)
13.0%
14.5%
16.0%
Discount
rate (%)
13.0%
14.5%
2.0%
16.0%
$57
268.736
$0.21
$52
265.741
$0.19
$47
264.920
$0.18
2.0%
$1.43
$0.21
$1.64
$1.05
$0.19
$1.25
2022A
$0.76
$0.18
$0.94
Perpetuity growth rate
3.0%
$57
269.796
$0.21
$52
266.091
$0.19
$47
265.176
$0.18
$1.58
$0.21
$1.79
$601
$1.16
$0.19
$1.35
Reconciliation to total equity value per share
Perpetuity growth rate
3.0%
$0.83
$0.18
$1.01
2023E
Source: Company filings, Bravo management, IRS bulletin as of 2/23.
(1)
($119)
29%
$12
$601
$601
$119
$119
4.0%
$57
272.132
$0.21
2024E
4.0%
($104)
29%
$12
$601
$601
$119
$104
$224
2025E
($64)
29%
$12
Based on fully diluted shares derived from discounted cash flow analysis excluding tax benefits.
$601
$601
Implied net present value
Fully diluted shares(1)
Implied net present value per share
$52 Implied net present value
267.372 Fully diluted shares(1)
$0.19 Implied net present value per share
$47 Implied net present value
265.423 Fully diluted shares(1)
$0.18
Implied net present value per share
$224
$64
$288
$1.75
Equity value per share - standalone DCF
Net present value per share - tax benefits
$0.21
$1.96 Implied total equity value per share
$1.27 Equity value per share - standalone DCF
$0.19 Net present value per share - tax benefits
$1.47 Implied total equity value per share
$0.92 Equity value per share standalone DCF
$0.18 Net present value per share - tax benefits
Implied total equity value per share
$1.09
2026E
($13)
29%
$12
$601
$601
$288
$13
$301
2027E
■
$59
I
■
59
29%
$17
$47
$12
$601
($12)
$589
Calendar year ended
2028E
$301
($47)
$254
$83
Assumptions
79
29%
$22
$67
$12
$589
($12)
$577
$254
($67)
$187
2029E
$110
100
29%
$28
$88
$12
$577
($12)
$565
$187
($88)
$99
2030E
$136
111
29%
$32
$109
$12
$565
($12)
$552
■ DCF discounted to 12/31/2022
Mid-year discounting convention
$99
($99)
2031 E
$163
12
29%
$3
$130
$12
$552
($12)
$540
2032E
$188
12
29%
$3
$151
$12
$540
($0)
($12)
$528
2033E
$902
$170
12
29%
$3
$528
$12
$516
Limitation on pre-tax income for NOL usage is equal to 80% of
pre-tax income
($1)
($12)
Assumes beginning tax asset balance of $600.7m as of 12/31/22
per Bravo management ($589.0m federal and state NOLs and
$11.7m R&D tax credits)
Implied net present value of tax benefits assumes NOLs are fully
utilized by 2055 (taking into account NOL expiration) Per Bravo
management
Assumes unlevered free cash flow projections discounted using
assumed 13.0%-16.0% WACC
Assumes tax rate of 29.0% per Bravo management
NOL S382 limitation based on merger consideration of $1.40 and
long-term tax-exempt rate of 3.29%
| Draft 18View entire presentation