Telia Company Results Presentation Deck
Finland
Service revenues
Reported currency, in SEK millions, like for like growth
3,017
Q2 21
3,007
Q3 21
-0.4%
3,110
Q4 21
3,092
Q1 22
Consumer Enterprise Other
3,117
Q2 22
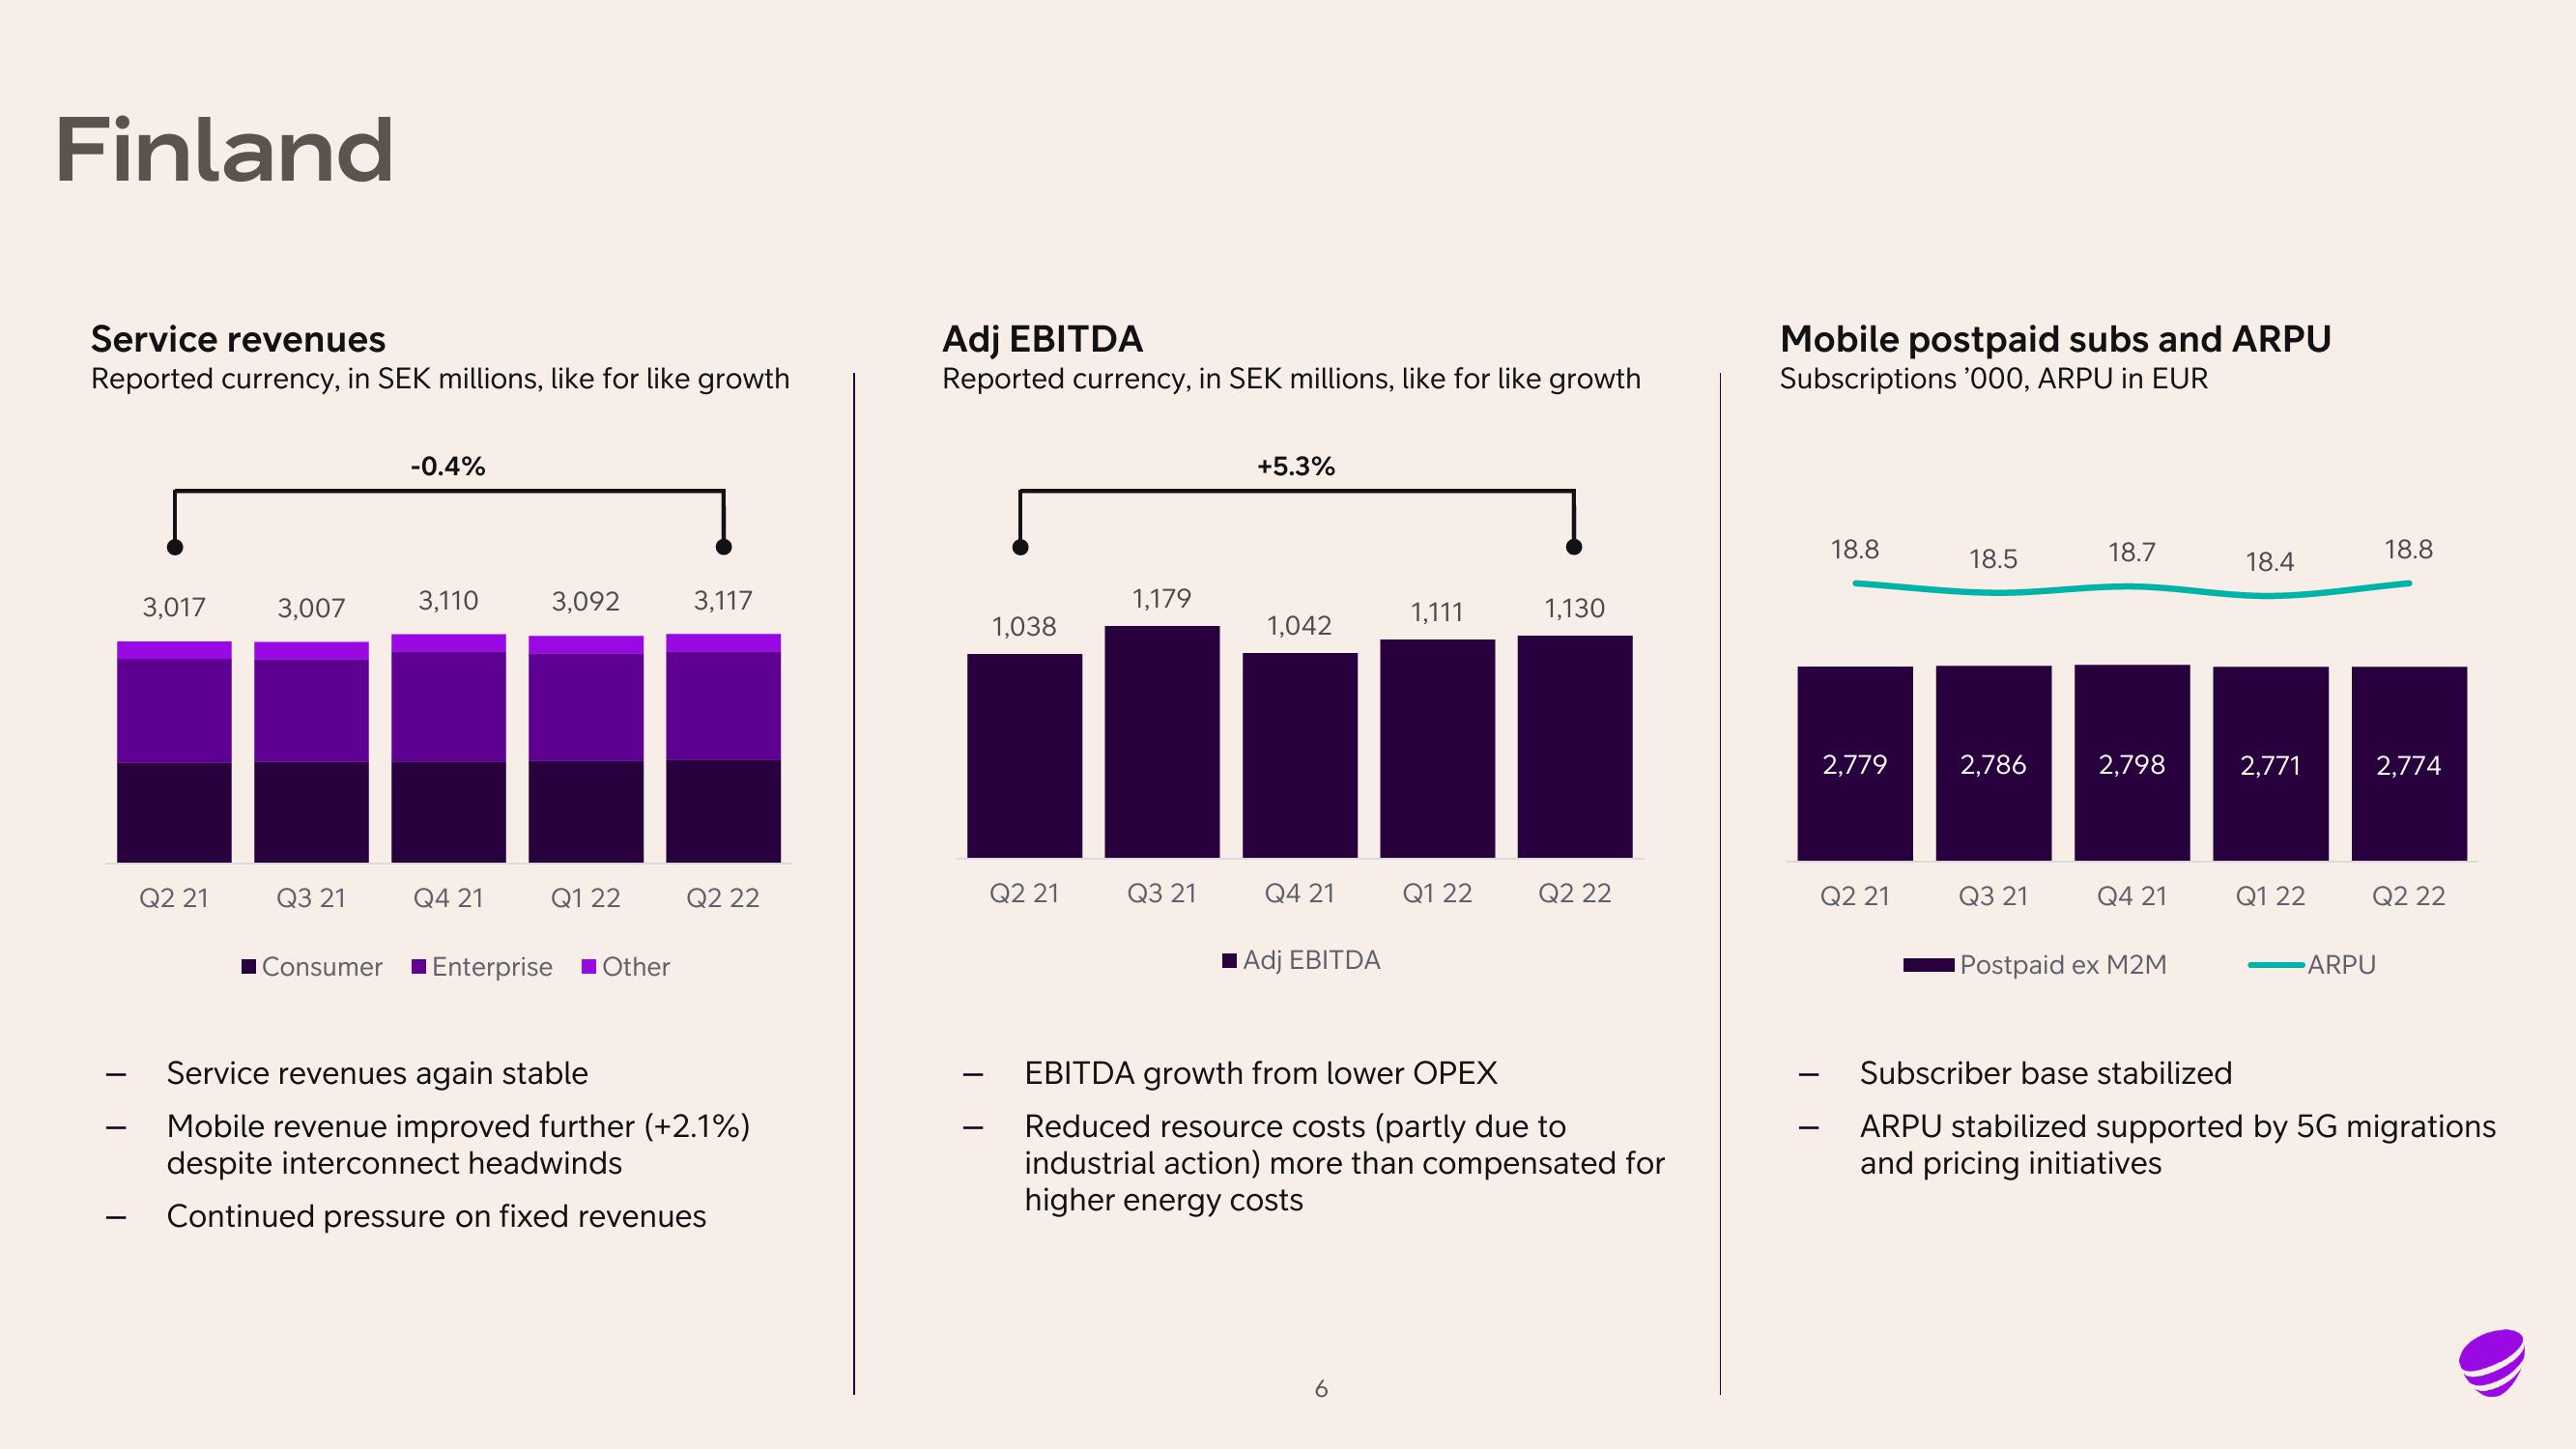
Service revenues again stable
Mobile revenue improved further (+2.1%)
despite interconnect headwinds
Continued pressure on fixed revenues
Adj EBITDA
Reported currency, in SEK millions, like for like growth
1,038
Q2 21
1,179
Q3 21
+5.3%
1,042
Q4 21
■Adj EBITDA
1,111
Q1 22
1,130
Q2 22
EBITDA growth from lower OPEX
Reduced resource costs (partly due to
industrial action) more than compensated for
higher energy costs
Mobile postpaid subs and ARPU
Subscriptions '000, ARPU in EUR
-
18.8
2,779
Q2 21
18.5
2,786
Q3 21
18.7
2,798
Q4 21
Postpaid ex M2M
18.4
2,771
Q1 22
18.8
ARPU
2,774
Q2 22
Subscriber base stabilized
ARPU stabilized supported by 5G migrations
and pricing initiativesView entire presentation