BuzzFeed SPAC Presentation Deck
BuzzFeed
Revenue
Advertising
% Growth
Content
% Growth
Commerce
% Growth
Total Revenue
% Growth
Adj. EBITDA (1)
% Growth
% Margin
2019A
Historical
$176
13%
202
(8%)
47
48%
$425
4%
($14)
NM
(3%)
Summary Financials
2020A
$198
13%
166
(18%)
57
20%
$421
(1%)
$17
NM
4%
2021E
$261
32%
165
(1%)
95
67%
$521
24%
$57
246%
11%
BuzzFeed Management Projections
2022E
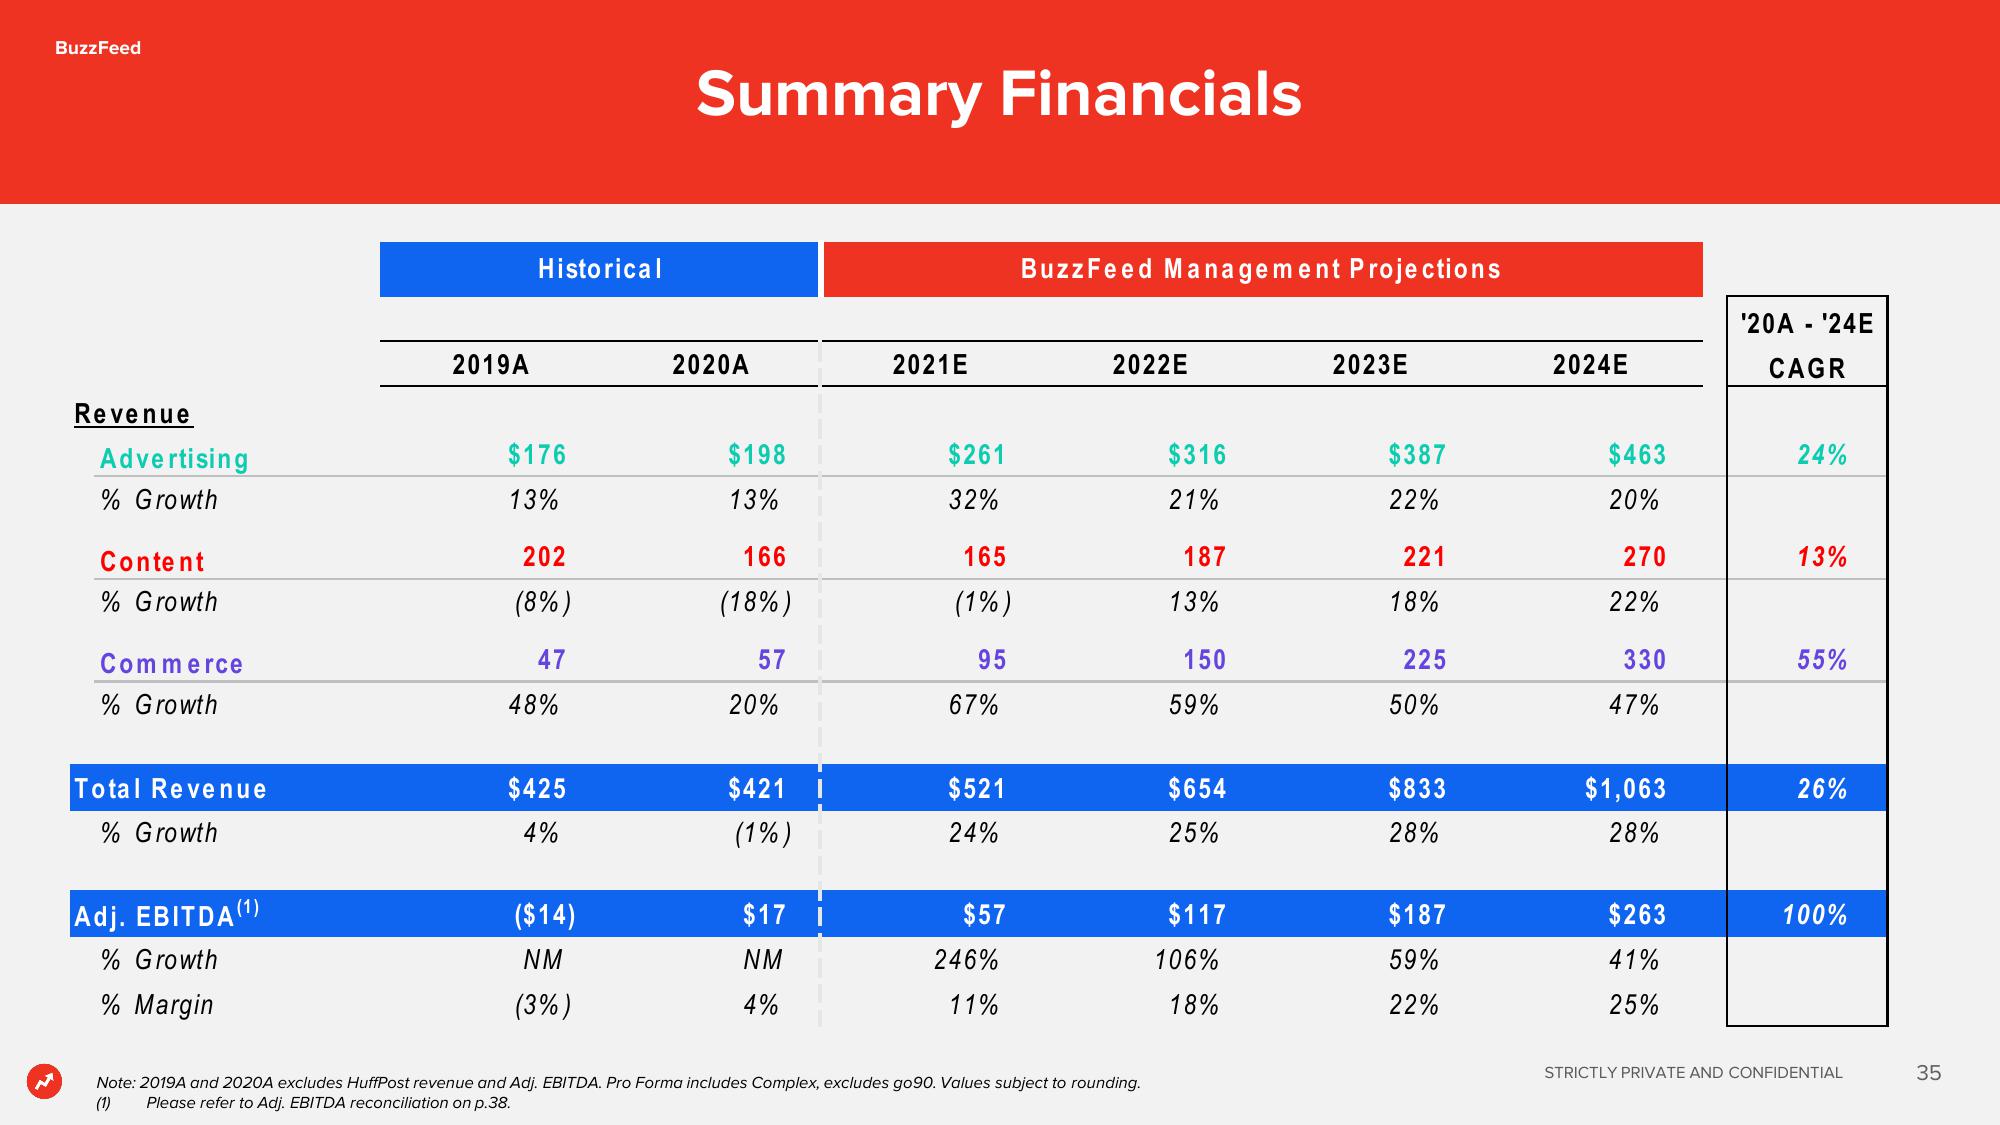
Note: 2019A and 2020A excludes HuffPost revenue and Adj. EBITDA. Pro Forma includes Complex, excludes go90. Values subject to rounding.
Please refer to Adj. EBITDA reconciliation on p.38.
(1)
$316
21%
187
13%
150
59%
$654
25%
$117
106%
18%
2023E
$387
22%
221
18%
225
50%
$833
28%
$187
59%
22%
2024E
$463
20%
270
22%
330
47%
$1,063
28%
$263
41%
25%
'20A - ¹24E
CAGR
24%
13%
55%
26%
100%
STRICTLY PRIVATE AND CONFIDENTIAL
35View entire presentation