Shopify Investor Presentation Deck
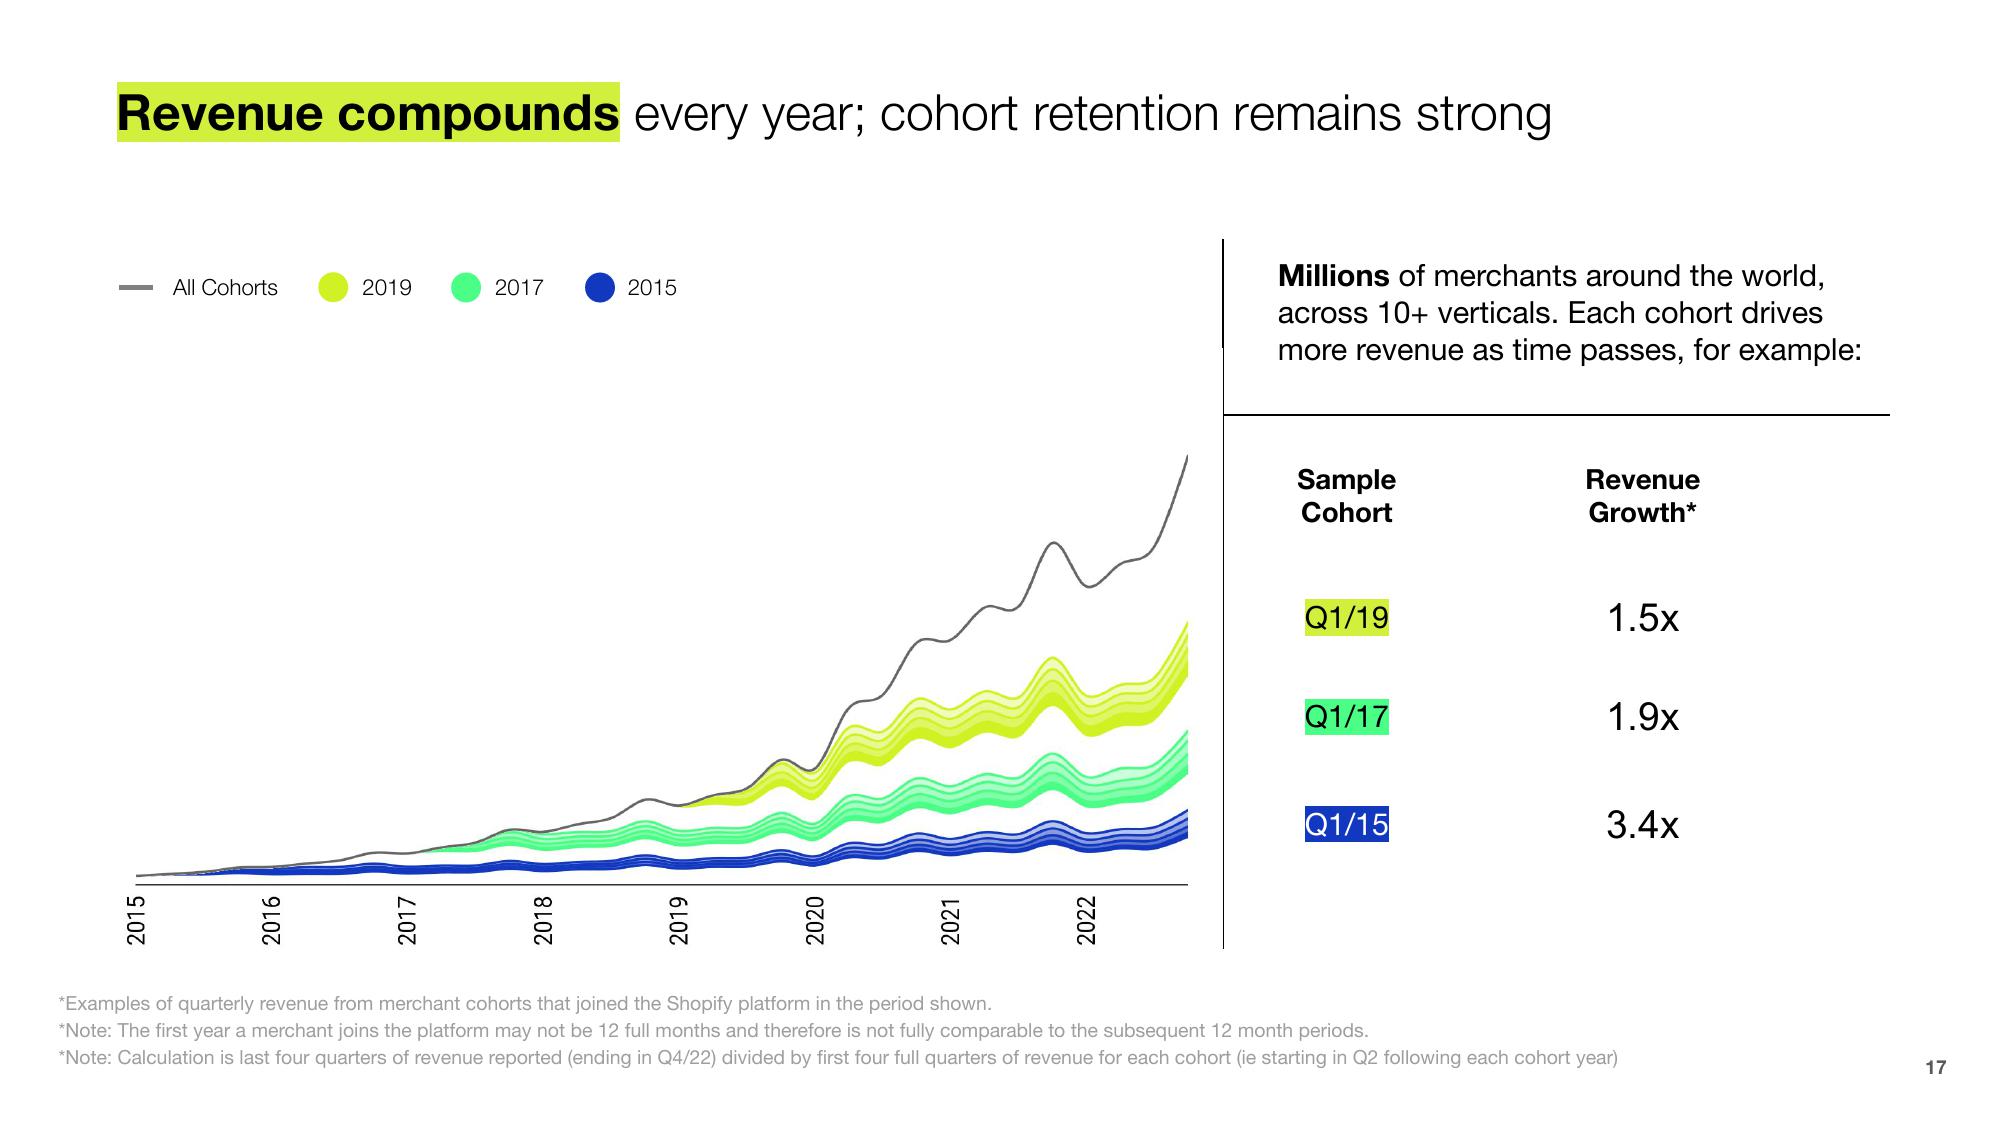
Revenue compounds every year; cohort retention remains strong
2015
All Cohorts
2016
2019
2017
2017
2015
Millions of merchants around the world,
across 10+ verticals. Each cohort drives
more revenue as time passes, for example:
Sample
Cohort
Q1/19
Q1/17
Q1/15
Revenue
Growth*
1.5x
1.9x
3.4x
*Examples of quarterly revenue from merchant cohorts that joined the Shopify platform in the period shown.
*Note: The first year a merchant joins the platform may not be 12 full months and therefore is not fully comparable to the subsequent 12 month periods.
*Note: Calculation is last four quarters of revenue reported (ending in Q4/22) divided by first four full quarters of revenue for each cohort (ie starting in Q2 following each cohort year)
17View entire presentation