Fresnillo Results Presentation Deck
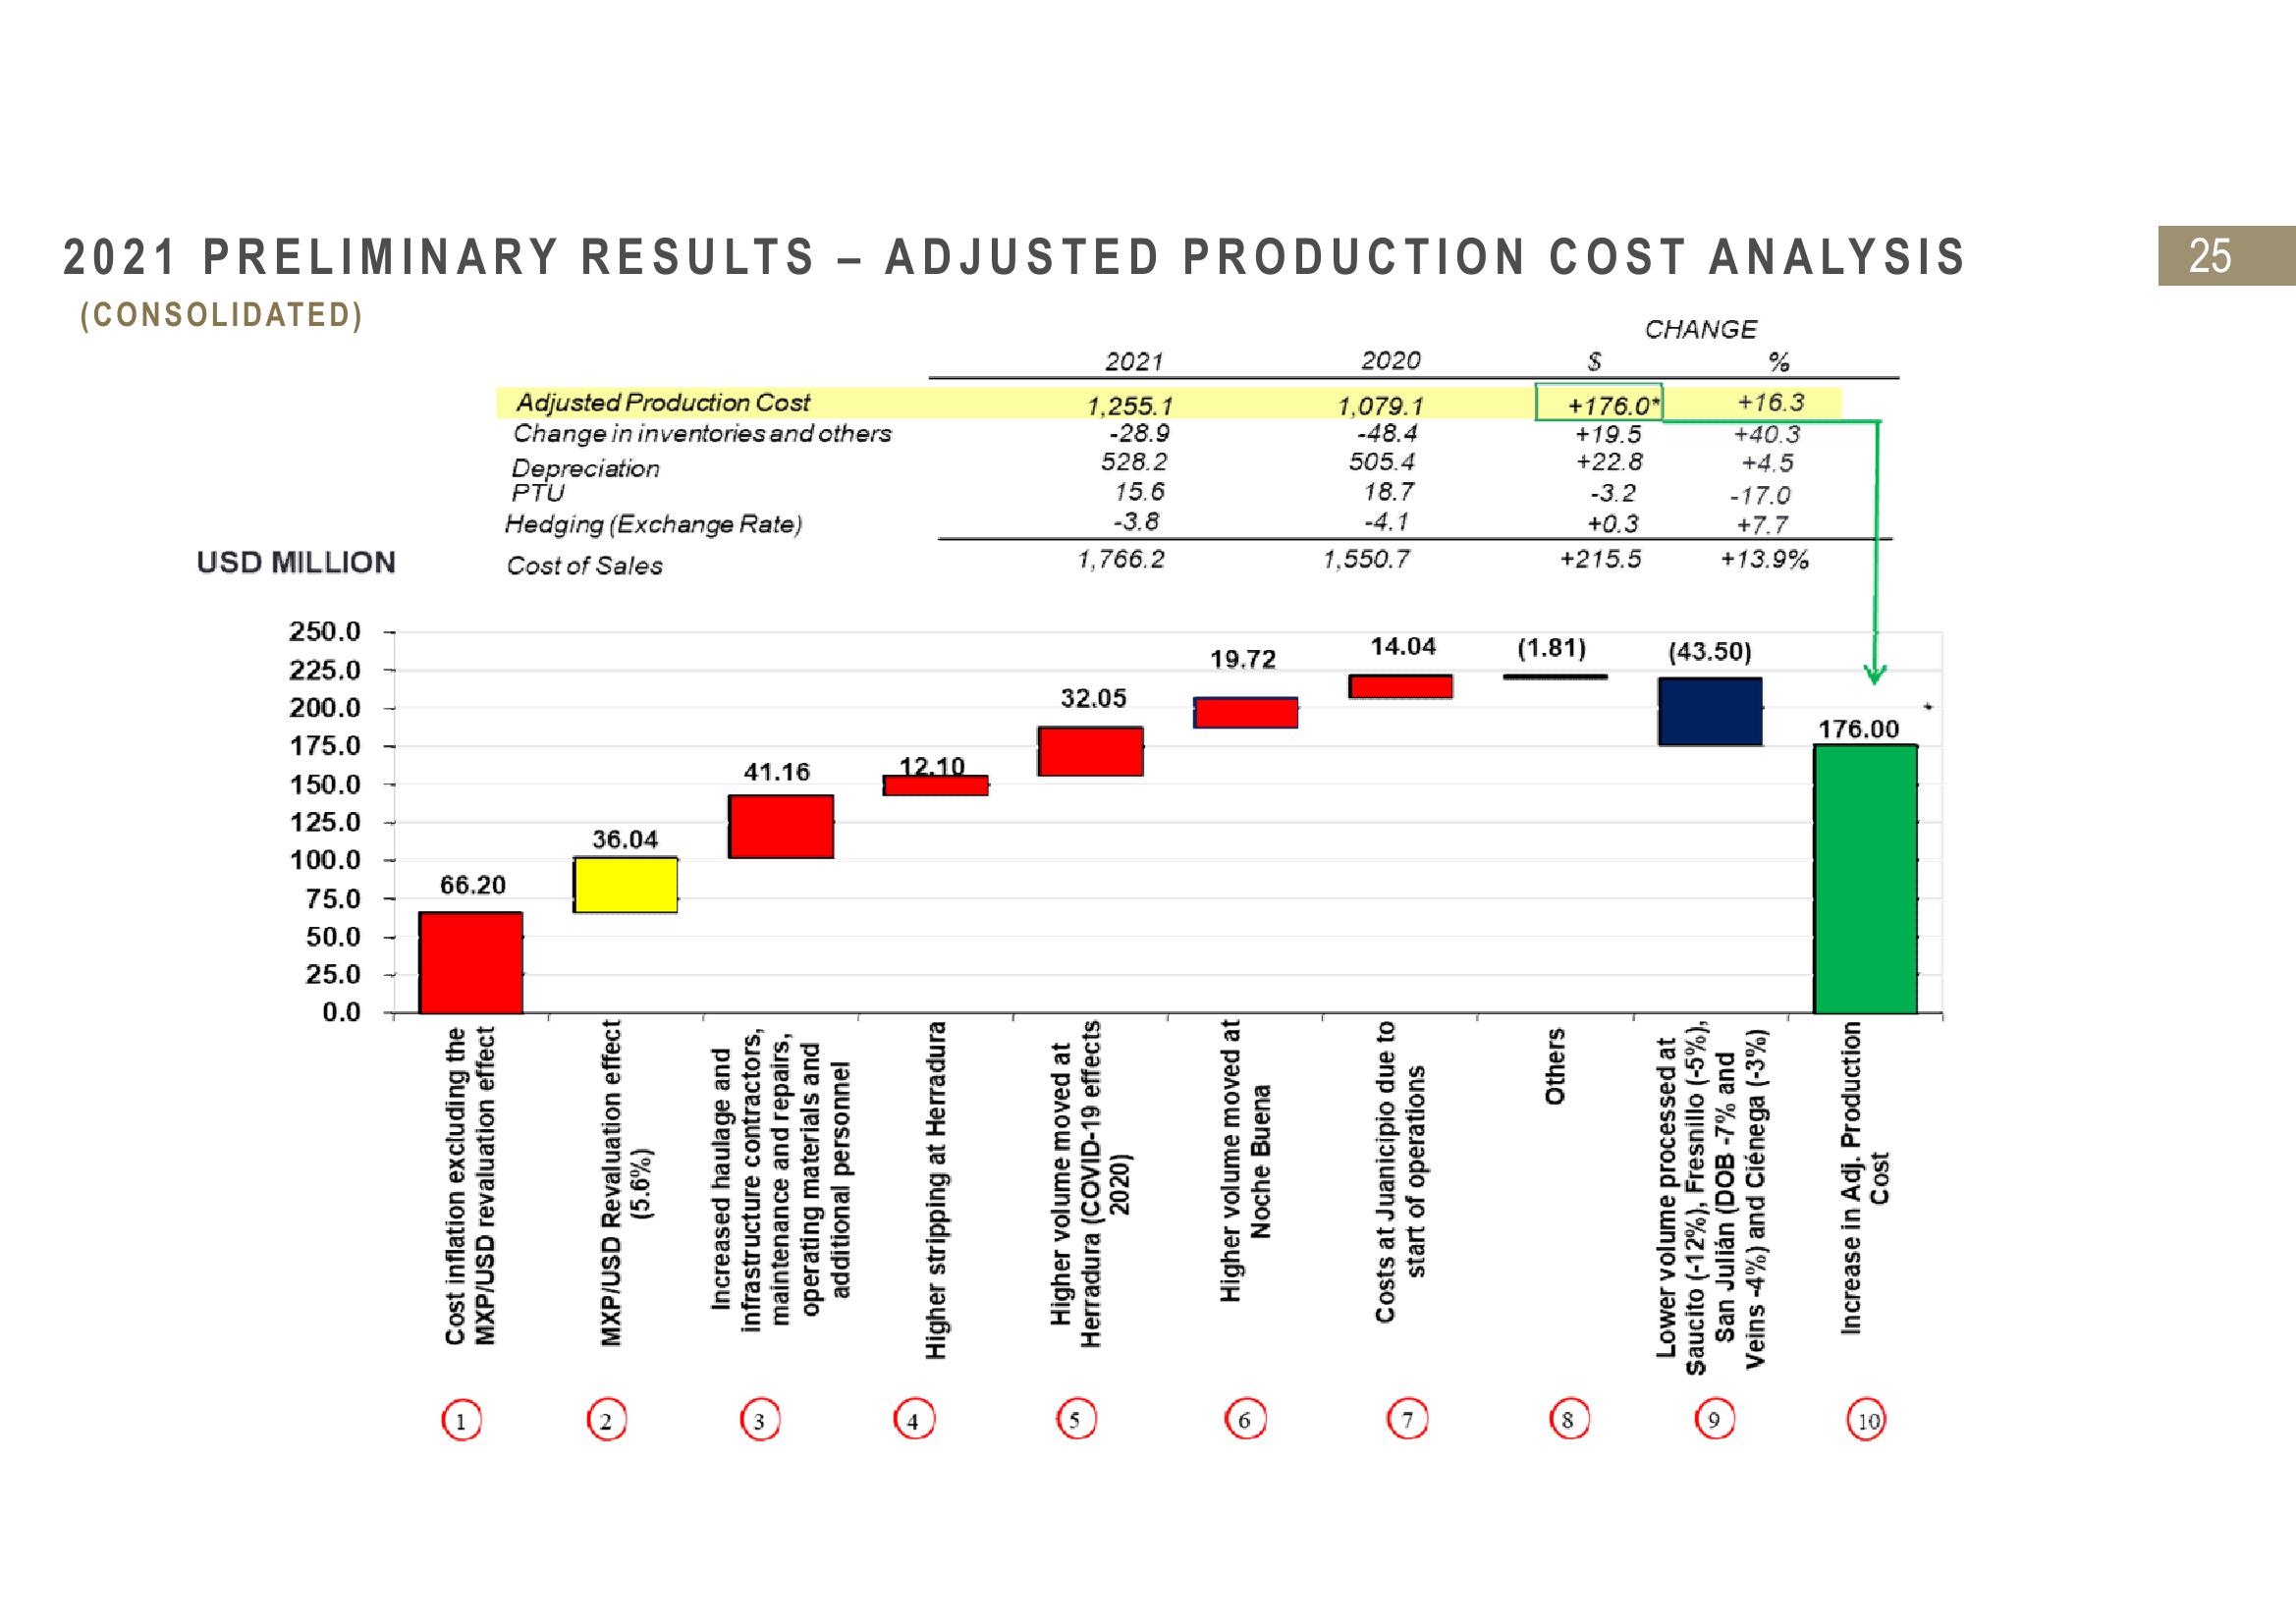
2021 PRELIMINARY RESULTS - ADJUSTED PRODUCTION COST ANALYSIS
(CONSOLIDATED)
USD MILLION
250.0
225.0
200.0
175.0
150.0
125.0
100.0
75.0
50.0
25.0
0.0
66.20
Cost inflation excluding the
MXP/USD revaluation effect
Adjusted Production Cost
Change in inventories and others
Depreciation
PTU
Hedging (Exchange Rate)
Cost of Sales
O
36.04
MXP/USD Revaluation effect
(5.6%)
41.16
Increased haulage and
infrastructure contractors,
maintenance and repairs,
operating materials and
additional personnel
3
12.10
Higher stripping at Herradura
4
2021
1,255.1
-28.9
528.2
15.6
-3.8
1,766.2
32.05
Higher volume moved at
Herradura (COVID-19 effects
2020)
19.72
Higher volume moved at
Noche Buena
6
2020
1,079.1
-48.4
505.4
18.7
-4.1
1.550.7
14.04
Costs at Juanicipio due to
start of operations
$
+176.0*
+19.5
+22.8
-3.2
+0.3
+215.5
(1.81)
Others
CHANGE
8
%
+16.3
+40.3
+4.5
-17.0
+7.7
+13.9%
(43.50)
Lower volume processed at
Saucito (-12%), Fresnillo (-5%),
San Julián (DOB -7% and
Veins -4%) and Ciénega (-3%)
176.00
Increase in Adj. Production
Cost
10)
25View entire presentation