GlobalFoundries Results Presentation Deck
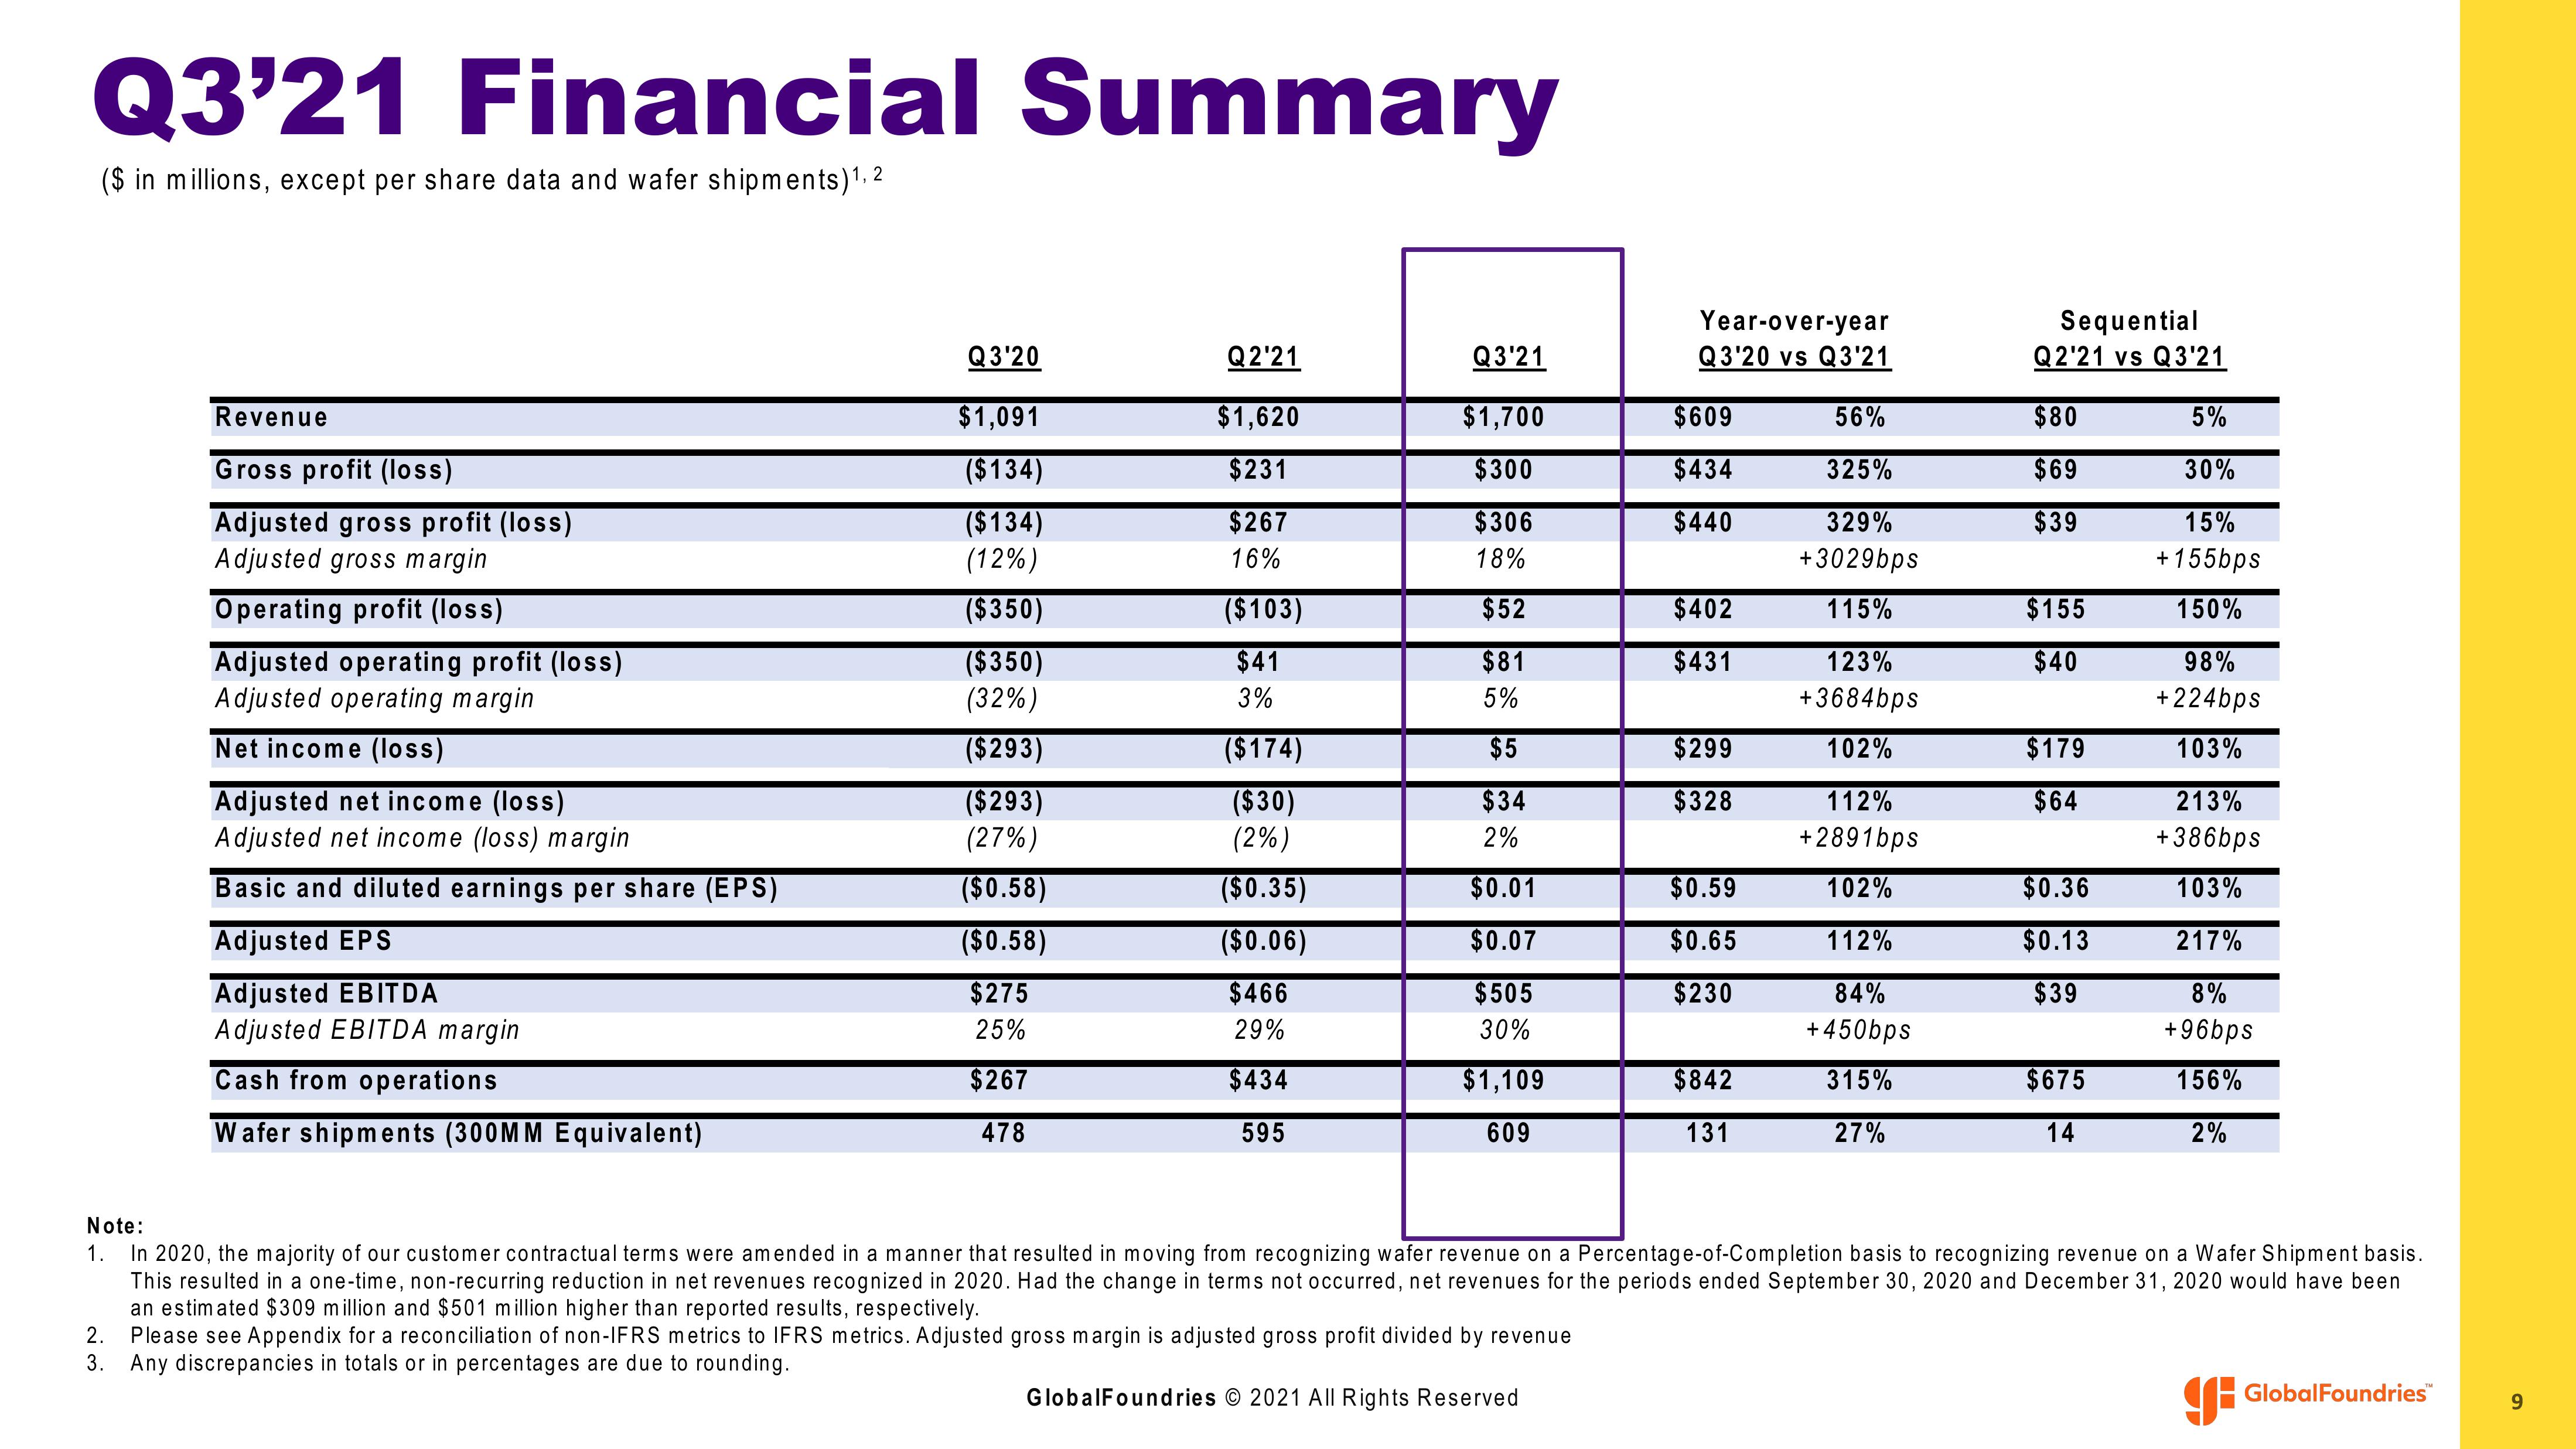
Q3'21 Financial Summary
($ in millions, except per share data and wafer shipments) ¹,2
Revenue
Gross profit (loss)
Adjusted gross profit (loss)
Adjusted gross margin
Operating profit (loss)
Adjusted operating profit (loss)
Adjusted operating margin
Net income (loss)
Adjusted net income (loss)
Adjusted net income (loss) margin
Basic and diluted earnings per share (EPS)
Adjusted EPS
Adjusted EBITDA
Adjusted EBITDA margin
Cash from operations
Wafer shipments (300MM Equivalent)
Q3'20
$1,091
($134)
($134)
(12%)
($350)
($350)
(32%)
($293)
($293)
(27%)
($0.58)
($0.58)
$275
25%
$267
478
Q2'21
$1,620
$231
$267
16%
($103)
$41
3%
($174)
($30)
(2%)
($0.35)
($0.06)
$466
29%
$434
595
Q3'21
$1,700
$300
$306
18%
$52
$81
5%
$5
$34
2%
$0.01
$0.07
$505
30%
$1,109
609
Year-over-year
Q3'20 vs Q3'21
GlobalFoundries © 2021 All Rights Reserved
$609
$434
$440
$402
$431
$299
$328
$0.59
$0.65
$230
$842
131
56%
325%
329%
+3029bps
115%
123%
+3684bps
102%
112%
+2891bps
102%
112%
84%
+450bps
315%
27%
Sequential
Q2'21 vs Q3'21
$80
$69
$39
$155
$40
$179
$64
$0.36
$0.13
$39
$675
14
5%
30%
15%
+155bps
150%
98%
+224bps
103%
213%
+386bps
103%
217%
8%
+96bps
156%
2%
Note:
1.
In 2020, the majority of our customer contractual terms were amended in a manner that resulted in moving from recognizing wafer revenue on a Percentage-of-Completion basis to recognizing revenue on a Wafer Shipment basis.
This resulted in a one-time, non-recurring reduction in net revenues recognized in 2020. Had the change in terms not occurred, net revenues for the periods ended September 30, 2020 and December 31, 2020 would have been
an estimated $309 million and $501 million higher than reported results, respectively.
2. Please see Appendix for a reconciliation of non-IFRS metrics to IFRS metrics. Adjusted gross margin is adjusted gross profit divided by revenue
3. Any discrepancies in totals or in percentages are due to rounding.
GlobalFoundries™
9View entire presentation