Sotheby's Investor Presentation Deck
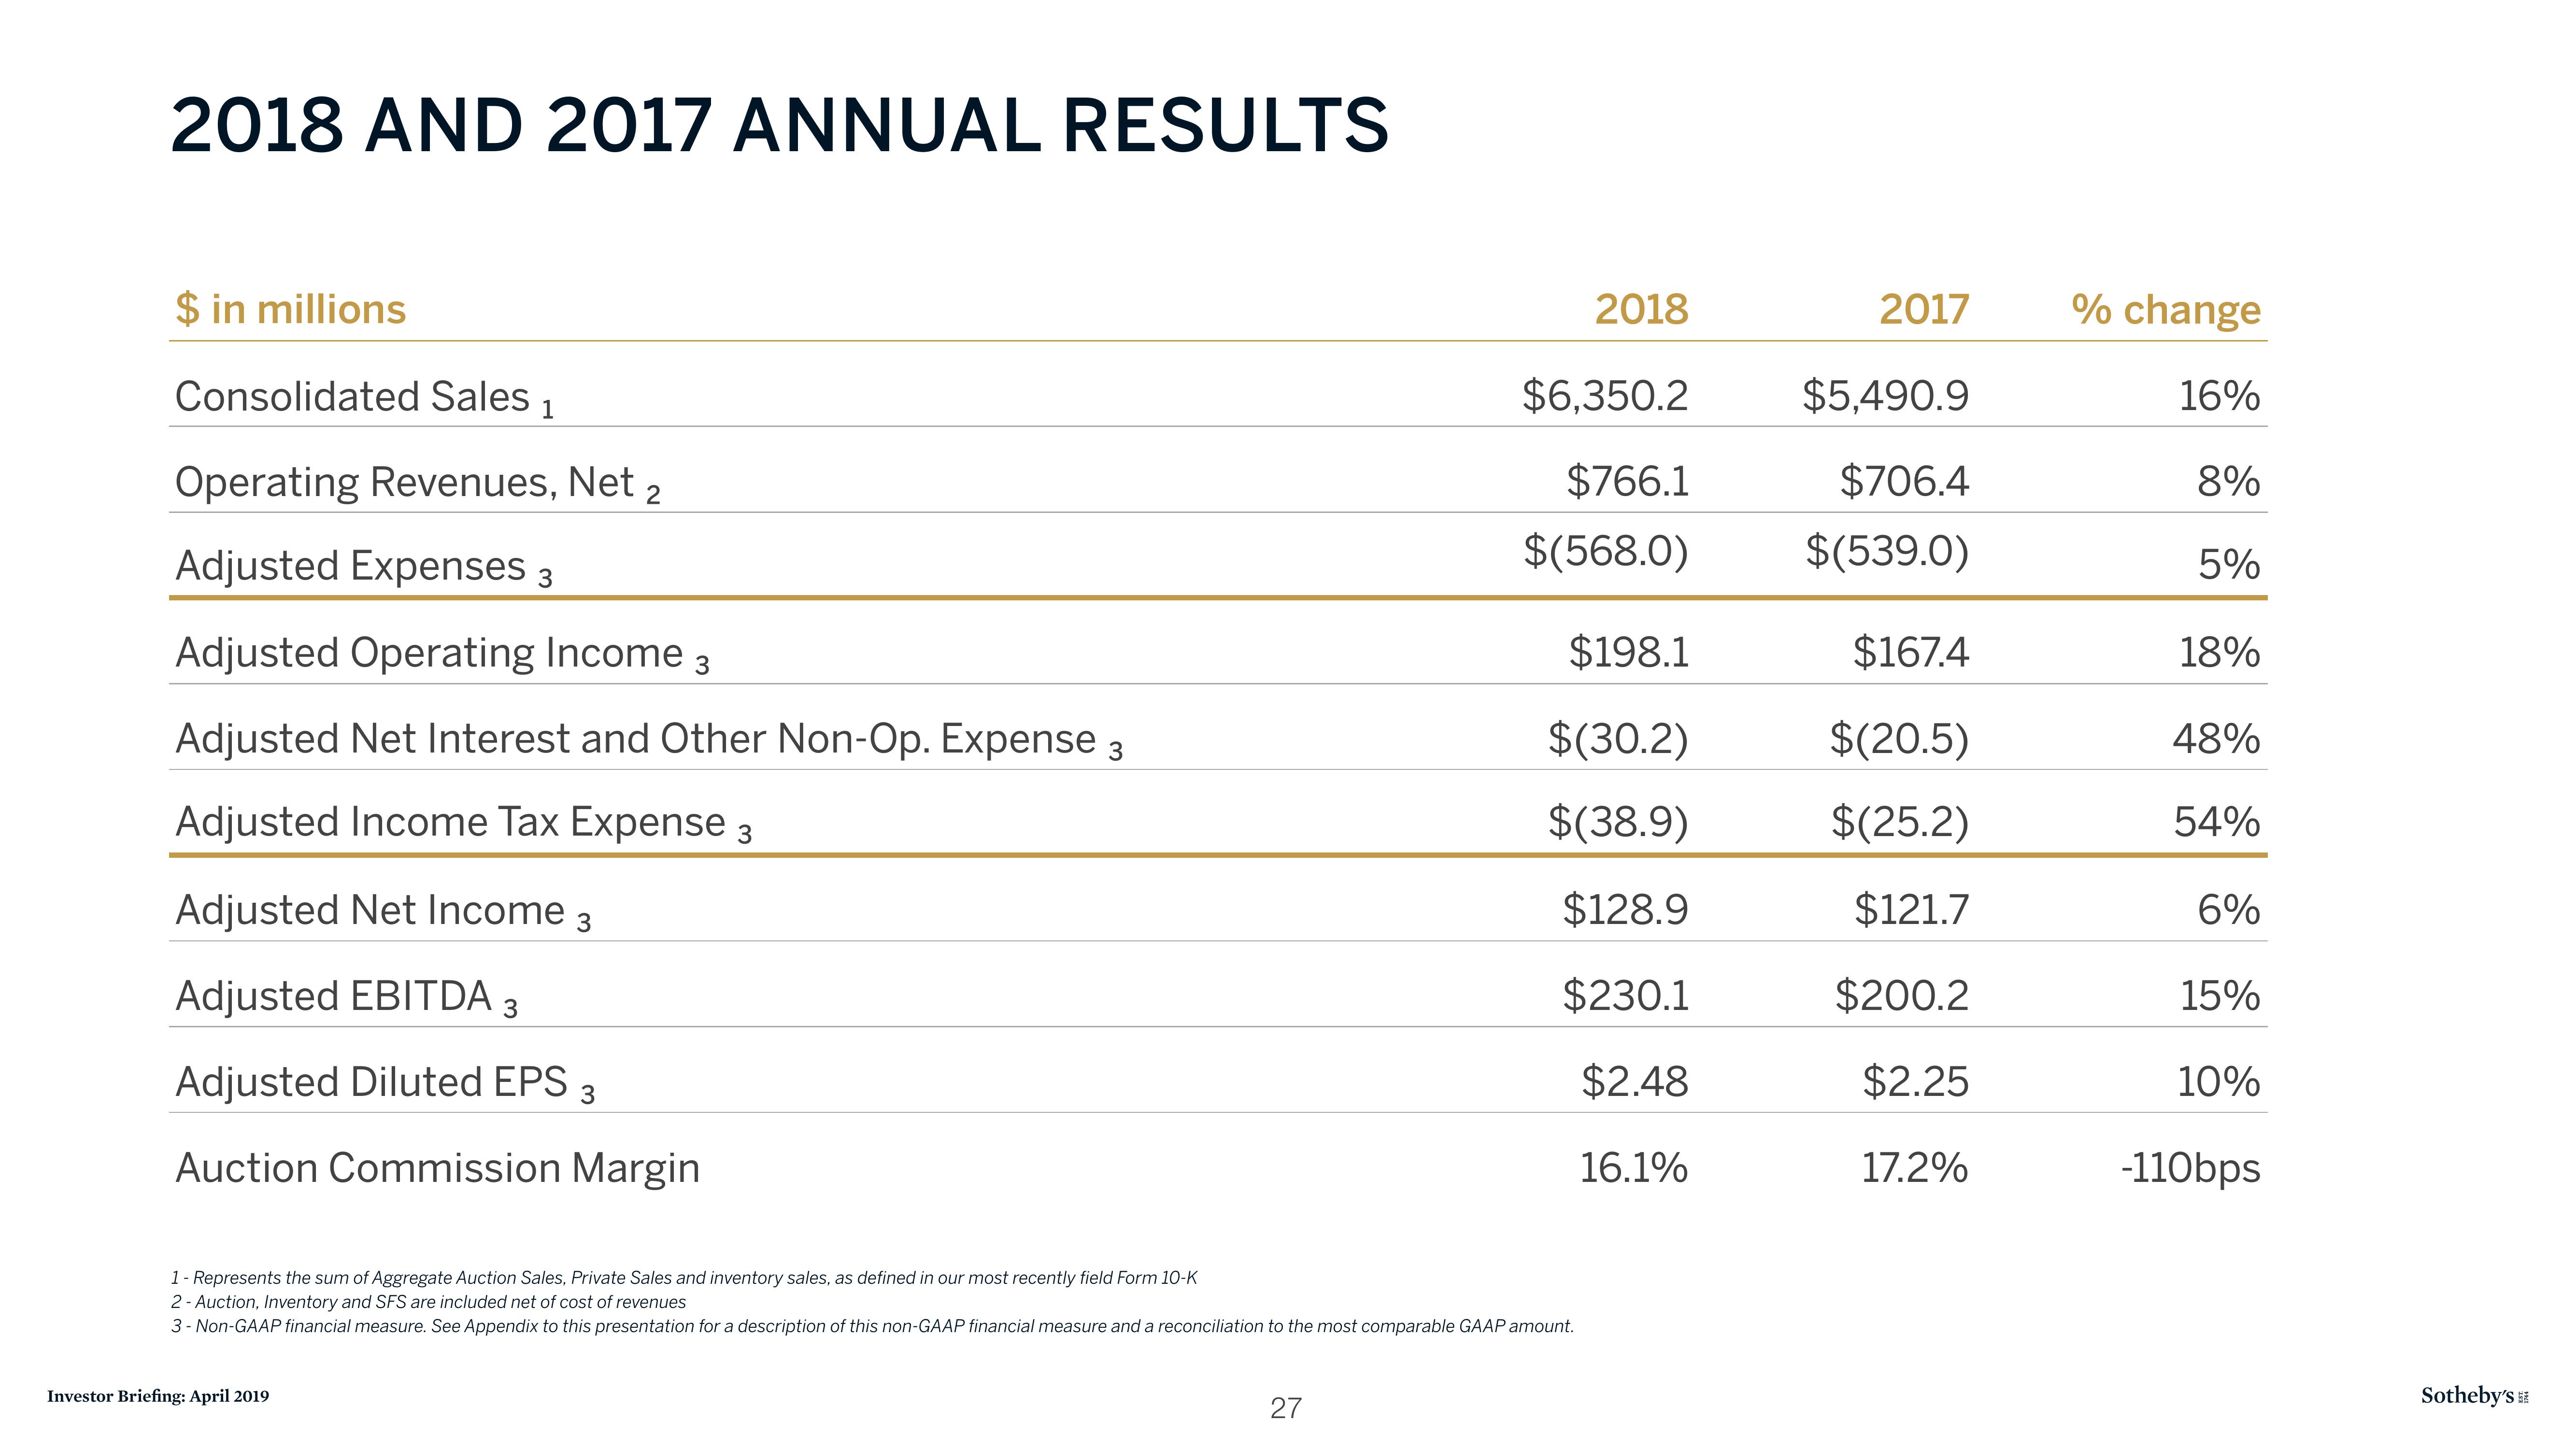
2018 AND 2017 ANNUAL RESULTS
$ in millions
Consolidated Sales ₁
Operating Revenues, Net 2
Adjusted Expenses 3
Adjusted Operating Income 3
Adjusted Net Interest and Other Non-Op. Expense 3
Adjusted Income Tax Expense 3
Adjusted Net Income 3
Adjusted EBITDA 3
Adjusted Diluted EPS 3
Auction Commission Margin
Investor Briefing: April 2019
1- Represents the sum of Aggregate Auction Sales, Private Sales and inventory sales, as defined in our most recently field Form 10-K
2-Auction, Inventory and SFS are included net of cost of revenues
3-Non-GAAP financial measure. See Appendix to this presentation for a description of this non-GAAP financial measure and a reconciliation to the most comparable GAAP amount.
27
2018
$6,350.2
$766.1
$(568.0)
$198.1
$(30.2)
$(38.9)
$128.9
$230.1
$2.48
16.1%
2017
$5,490.9
$706.4
$(539.0)
$167.4
$(20.5)
$(25.2)
$121.7
$200.2
$2.25
17.2%
% change
16%
8%
5%
18%
48%
54%
6%
15%
10%
-110bps
Sotheby'sView entire presentation