jetBlue Results Presentation Deck
CAPACITY DEPLOYMENT ALIGNED WITH DEMAND TRENDS
jetBlue
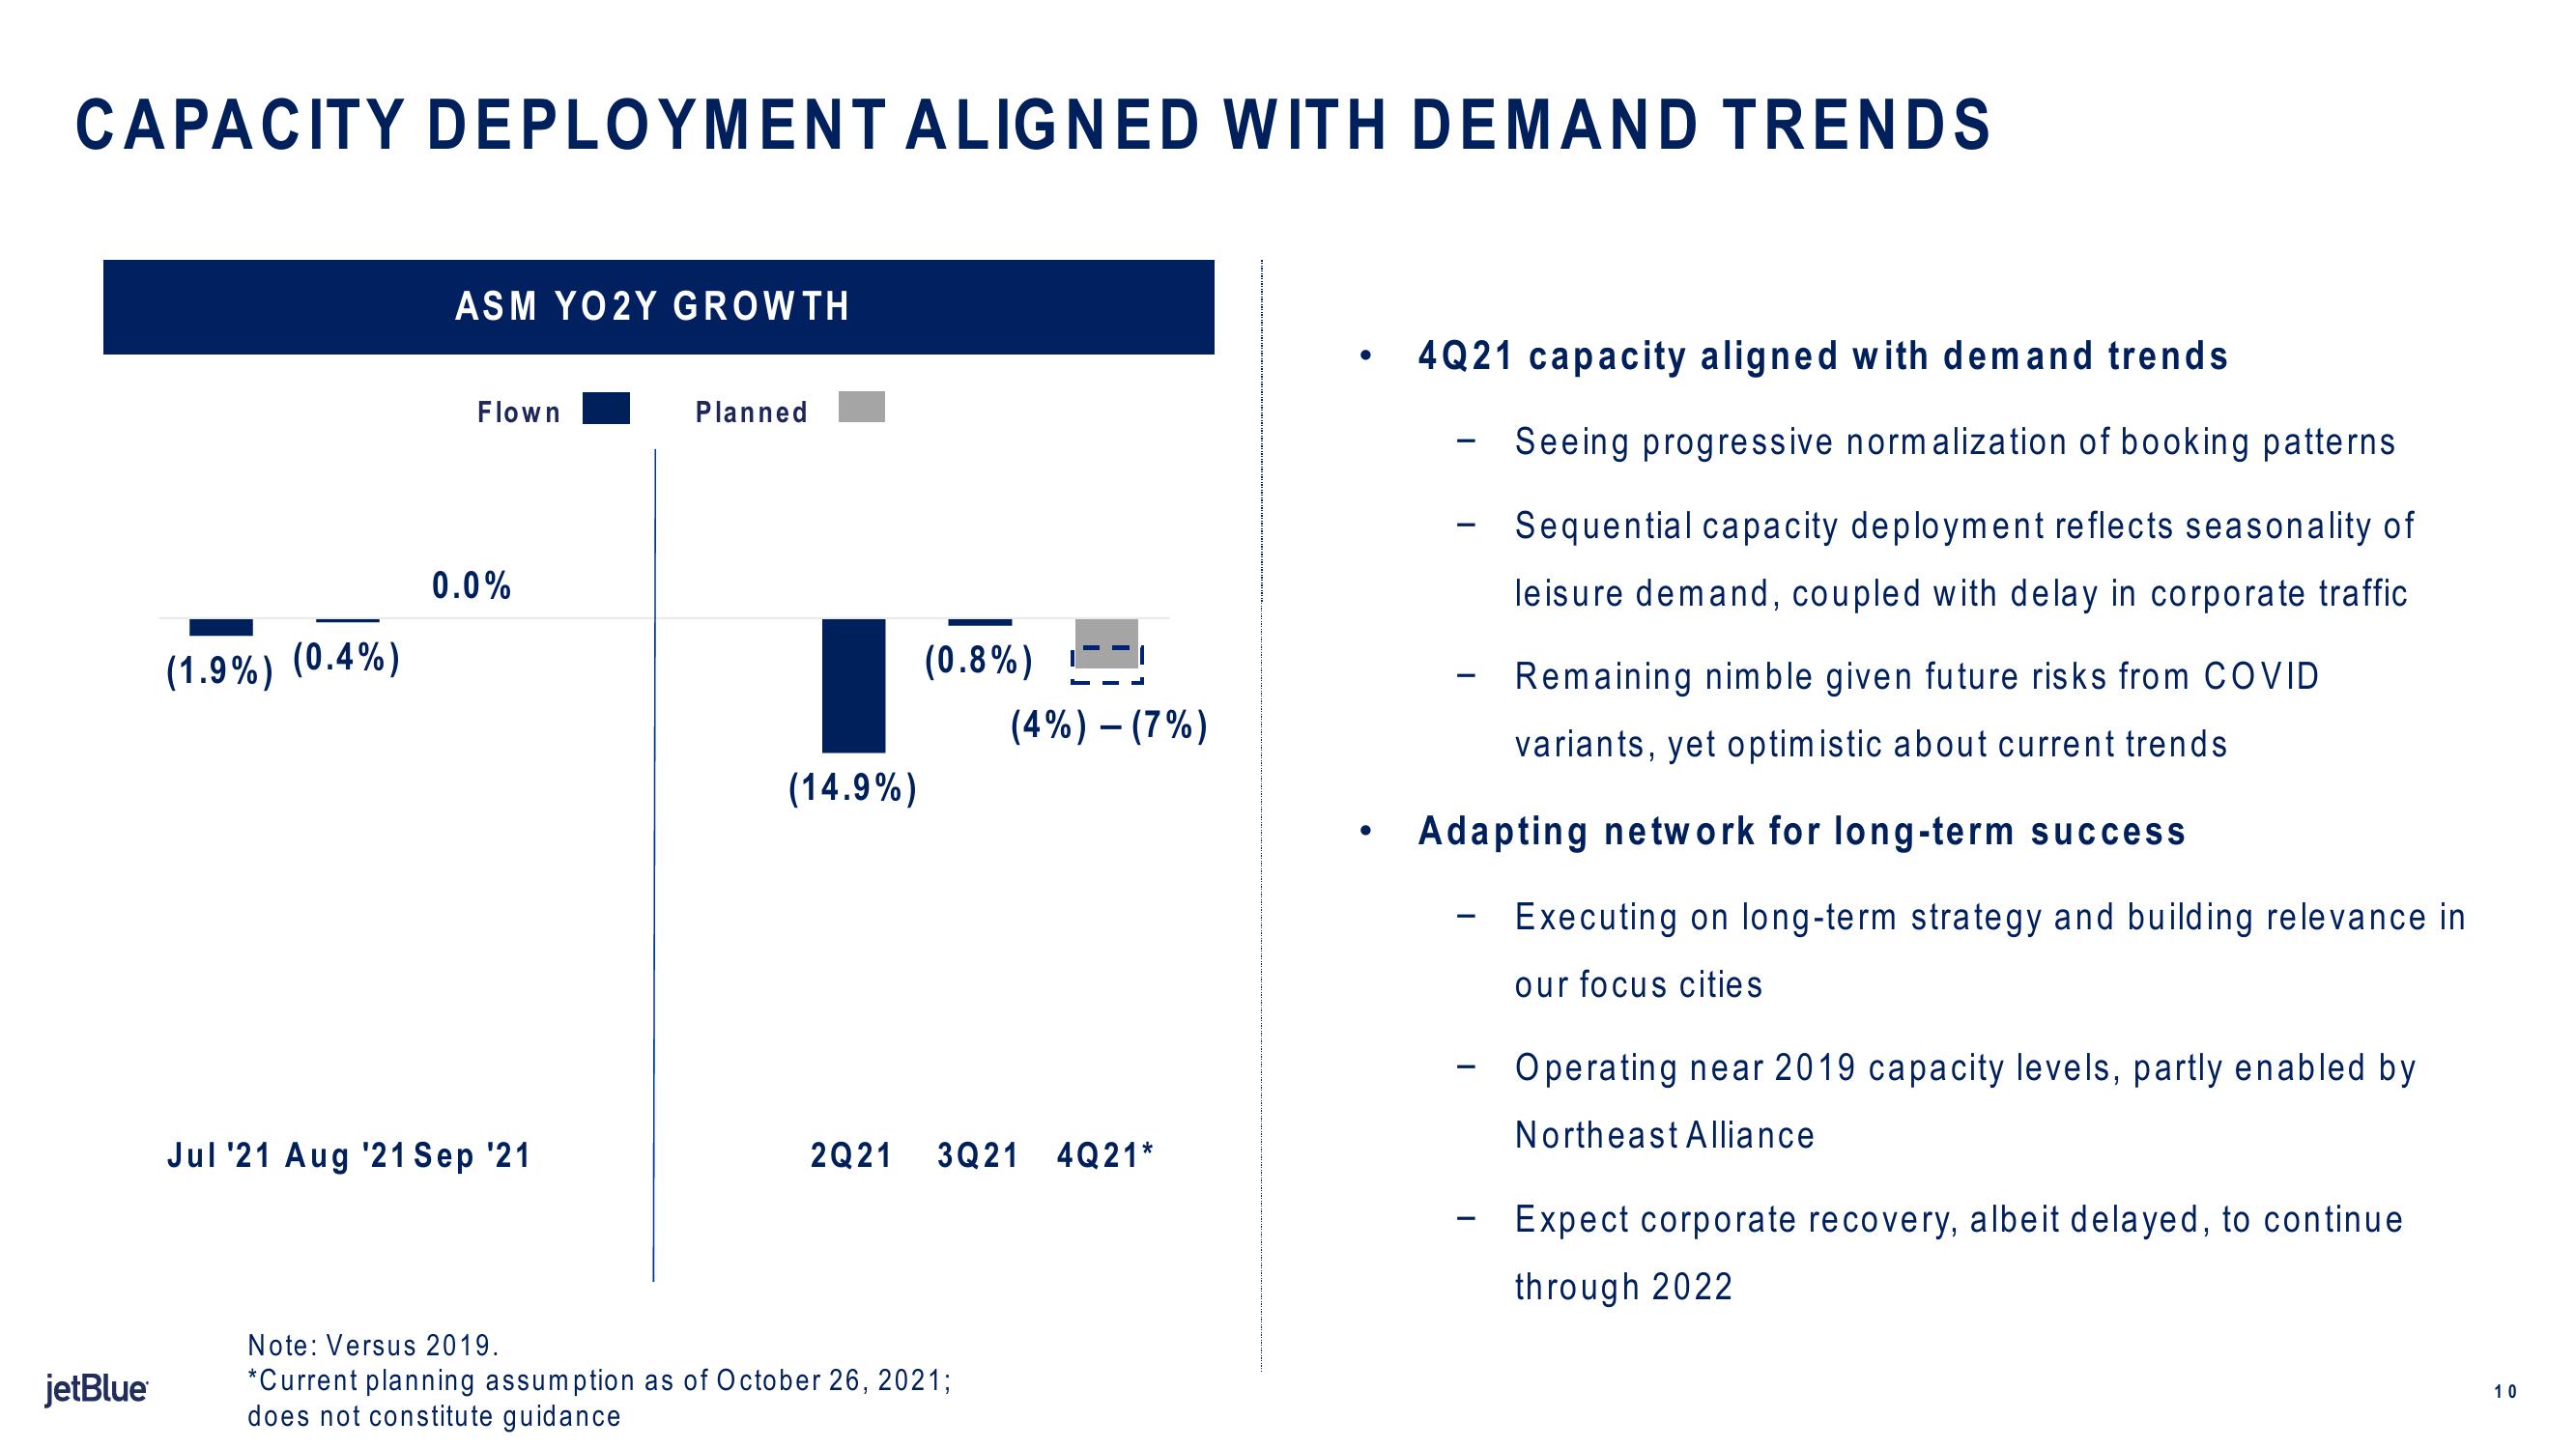
(1.9%) (0.4%)
ASM YO2Y GROWTH
Flown
0.0%
Jul '21 Aug '21 Sep '21
Planned
(14.9%)
(0.8%)
(4%) - (7%)
2Q21 3Q21 4Q21*
Note: Versus 2019.
*Current planning assumption as of October 26, 2021;
does not constitute guidance
4Q21 capacity aligned with demand trends
-
Adapting network for long-term success
-
Seeing progressive normalization of booking patterns
Sequential capacity deployment reflects seasonality of
leisure demand, coupled with delay in corporate traffic.
Remaining nimble given future risks from COVID
variants, yet optimistic about current trends
-
Executing on long-term strategy and building relevance in
our focus cities
Operating near 2019 capacity levels, partly enabled by
Northeast Alliance
Expect corporate recovery, albeit delayed, to continue
through 2022
10View entire presentation