GMS Investor Presentation Deck
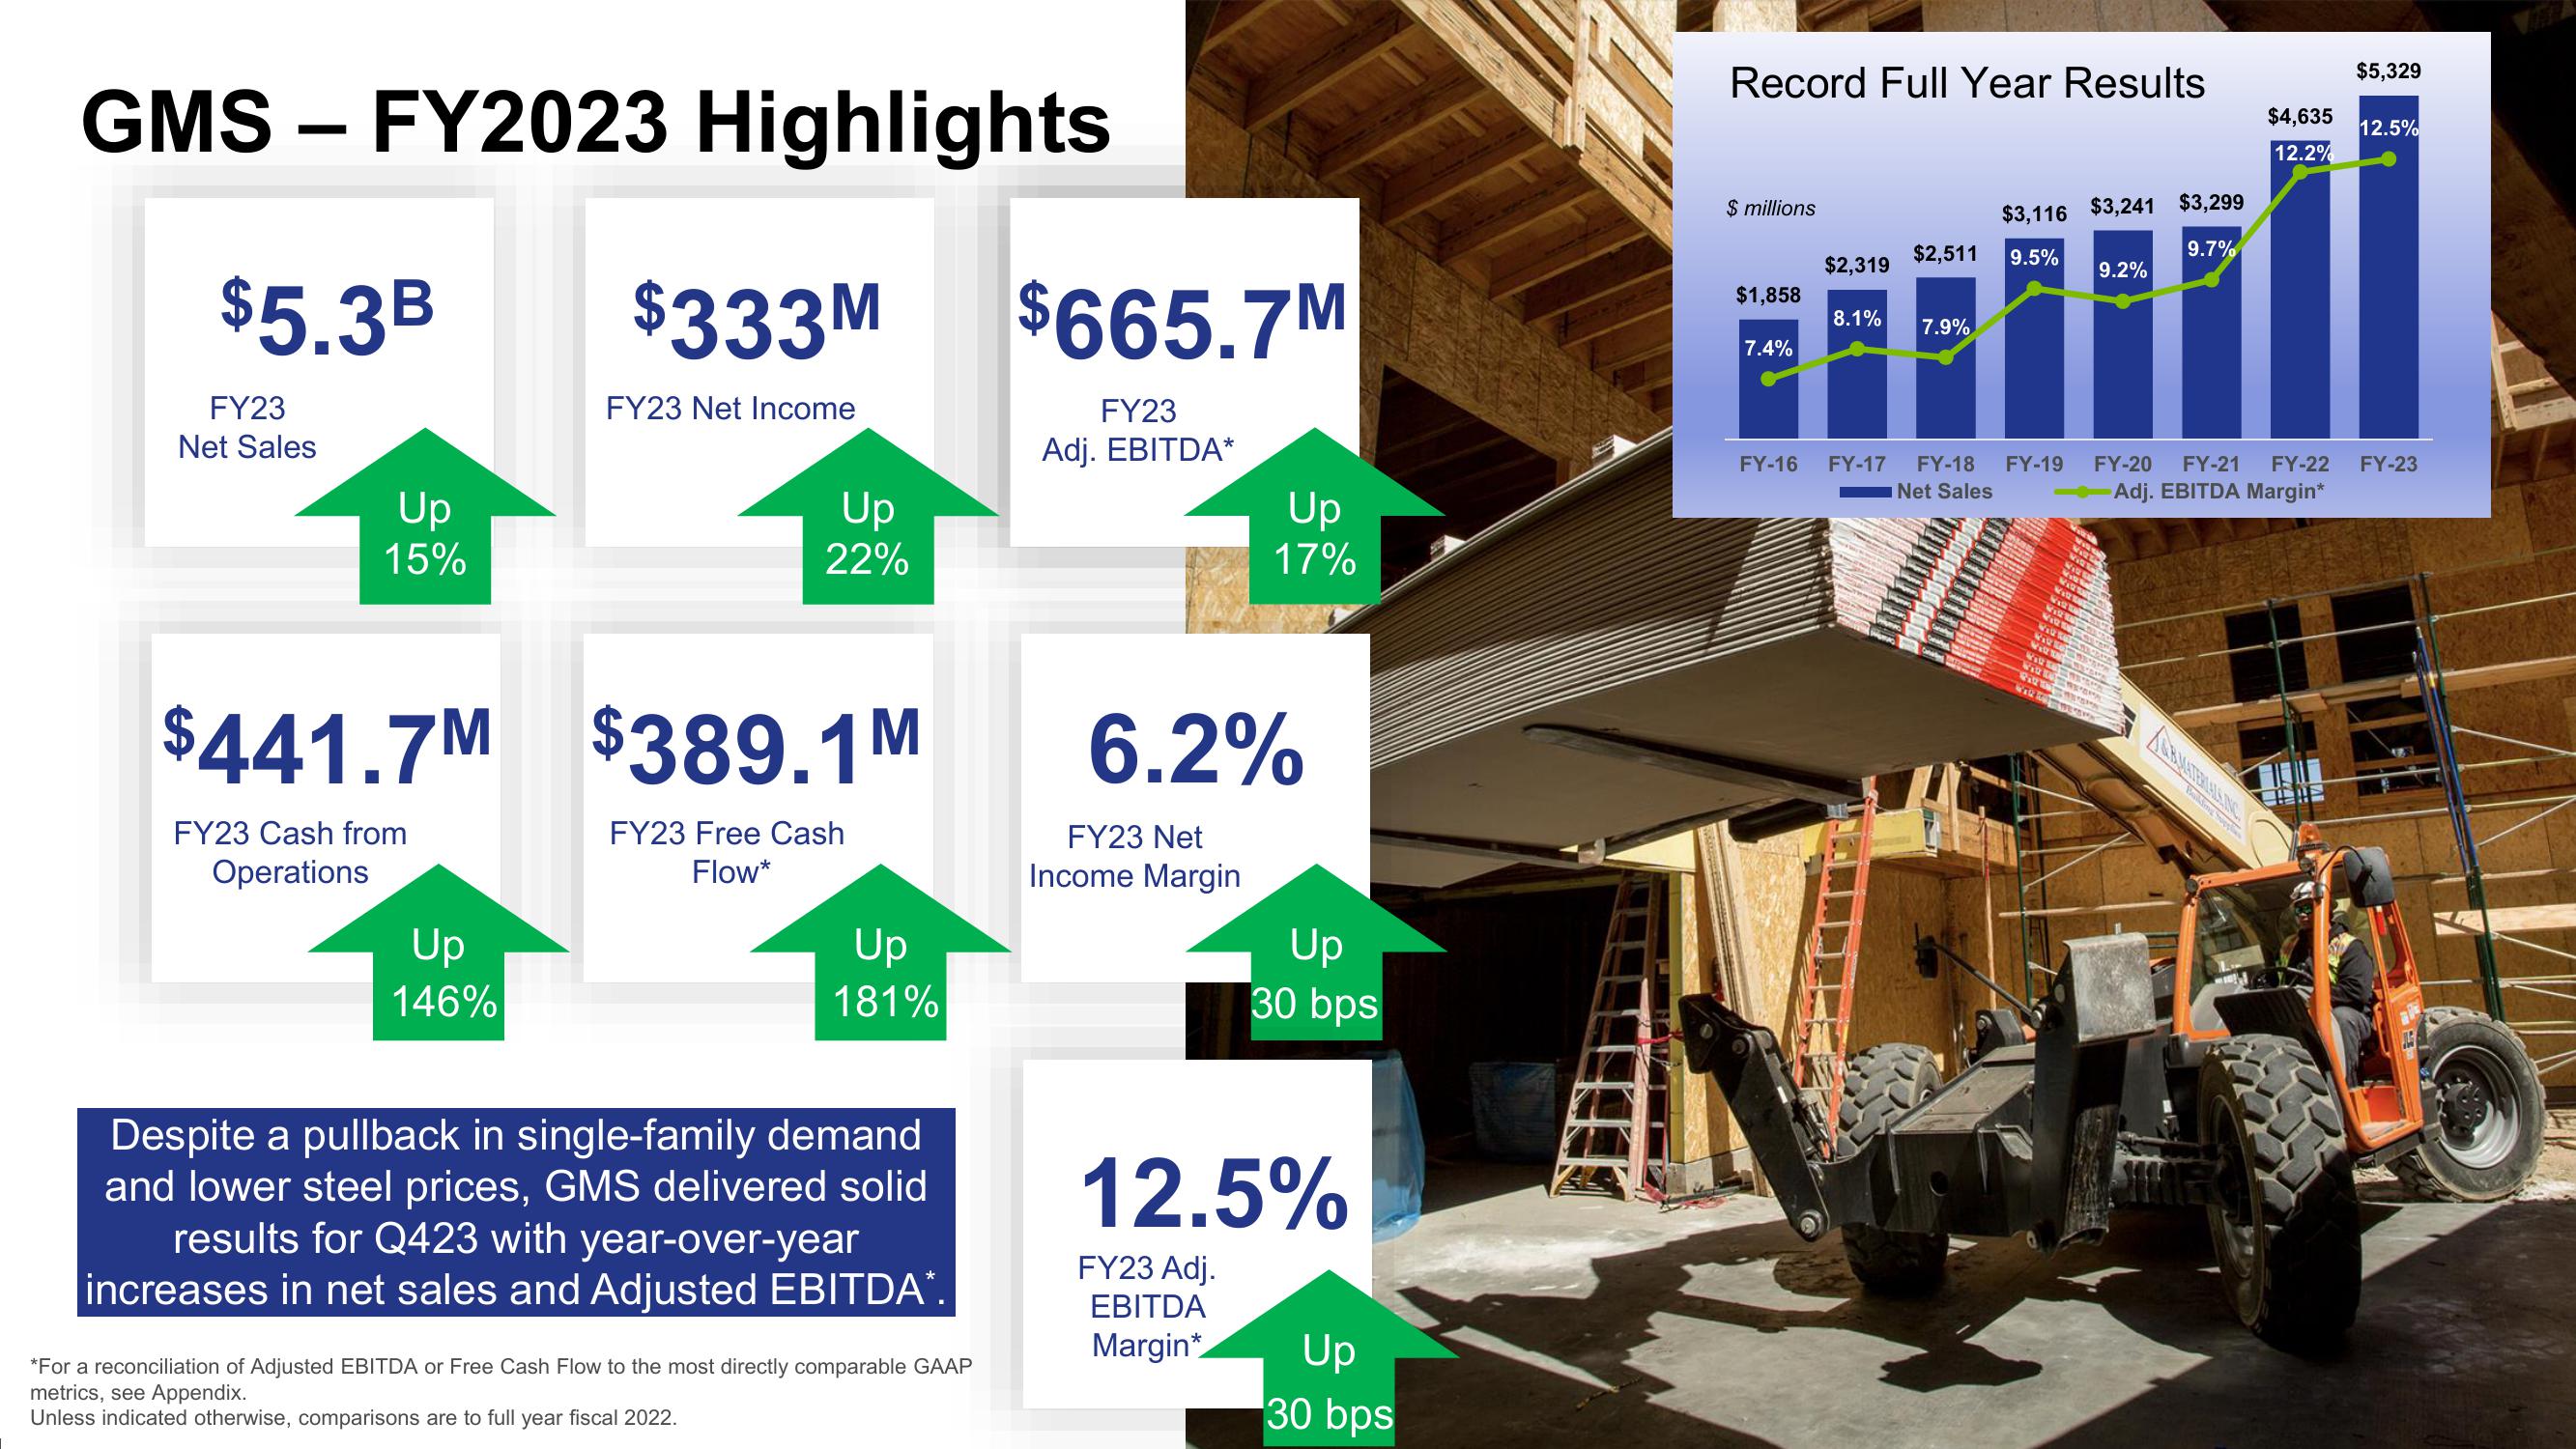
GMS-FY2023 Highlights
$5.3B
FY23
Net Sales
Up
15%
$333M
Up
146%
FY23 Net Income
Up
22%
$441.7M $389.1M
FY23 Cash from
FY23 Free Cash
Operations
Flow*
Up
181%
Despite a pullback in single-family demand
and lower steel prices, GMS delivered solid
results for Q423 with year-over-year
increases in net sales and Adjusted EBITDA*.
*For a reconciliation of Adjusted EBITDA or Free Cash Flow to the most directly comparable GAAP
metrics, see Appendix.
Unless indicated otherwise, comparisons are to full year fiscal 2022.
$665.7M
FY23
Adj. EBITDA*
Up
17%
6.2%
FY23 Net
Income Margin
Up
30 bps
12.5%
FY23 Adj.
EBITDA
Margin*
Up
30 bps
Record Full Year Results
$ millions
$1,858
7.4%
$2,319
8.1%
$2,511
7.9%
$3,116 $3,241 $3,299
9.5%
9.7%
9.2%
www
www
P120
Www.
$5,329
$4,635 12.5%
12.2%
FY-16 FY-17 FY-18 FY-19 FY-20 FY-21 FY-22 FY-23
Net Sales
Adj. EBITDA Margin*
CDView entire presentation