Trian Partners Activist Presentation Deck
P&G Has Underperformed Under this Board's Watch, Yet It Claims
Unequivocally that Nelson Peltz Would Not Add Value
"Adding Nelson Peltz of Trianon our Board has the potential to derail the transformation we're leading
"Adding Nelson Peltz of Trian on our Board has the potential to derail the transformation we're leading at P&G... P&G
has a diverse and experienced Board that is actively overseeing our transformation and will continue to be agents of
change to improve P&G's global performance." - David Taylor, August 1, 2017
ust 1, 20
■
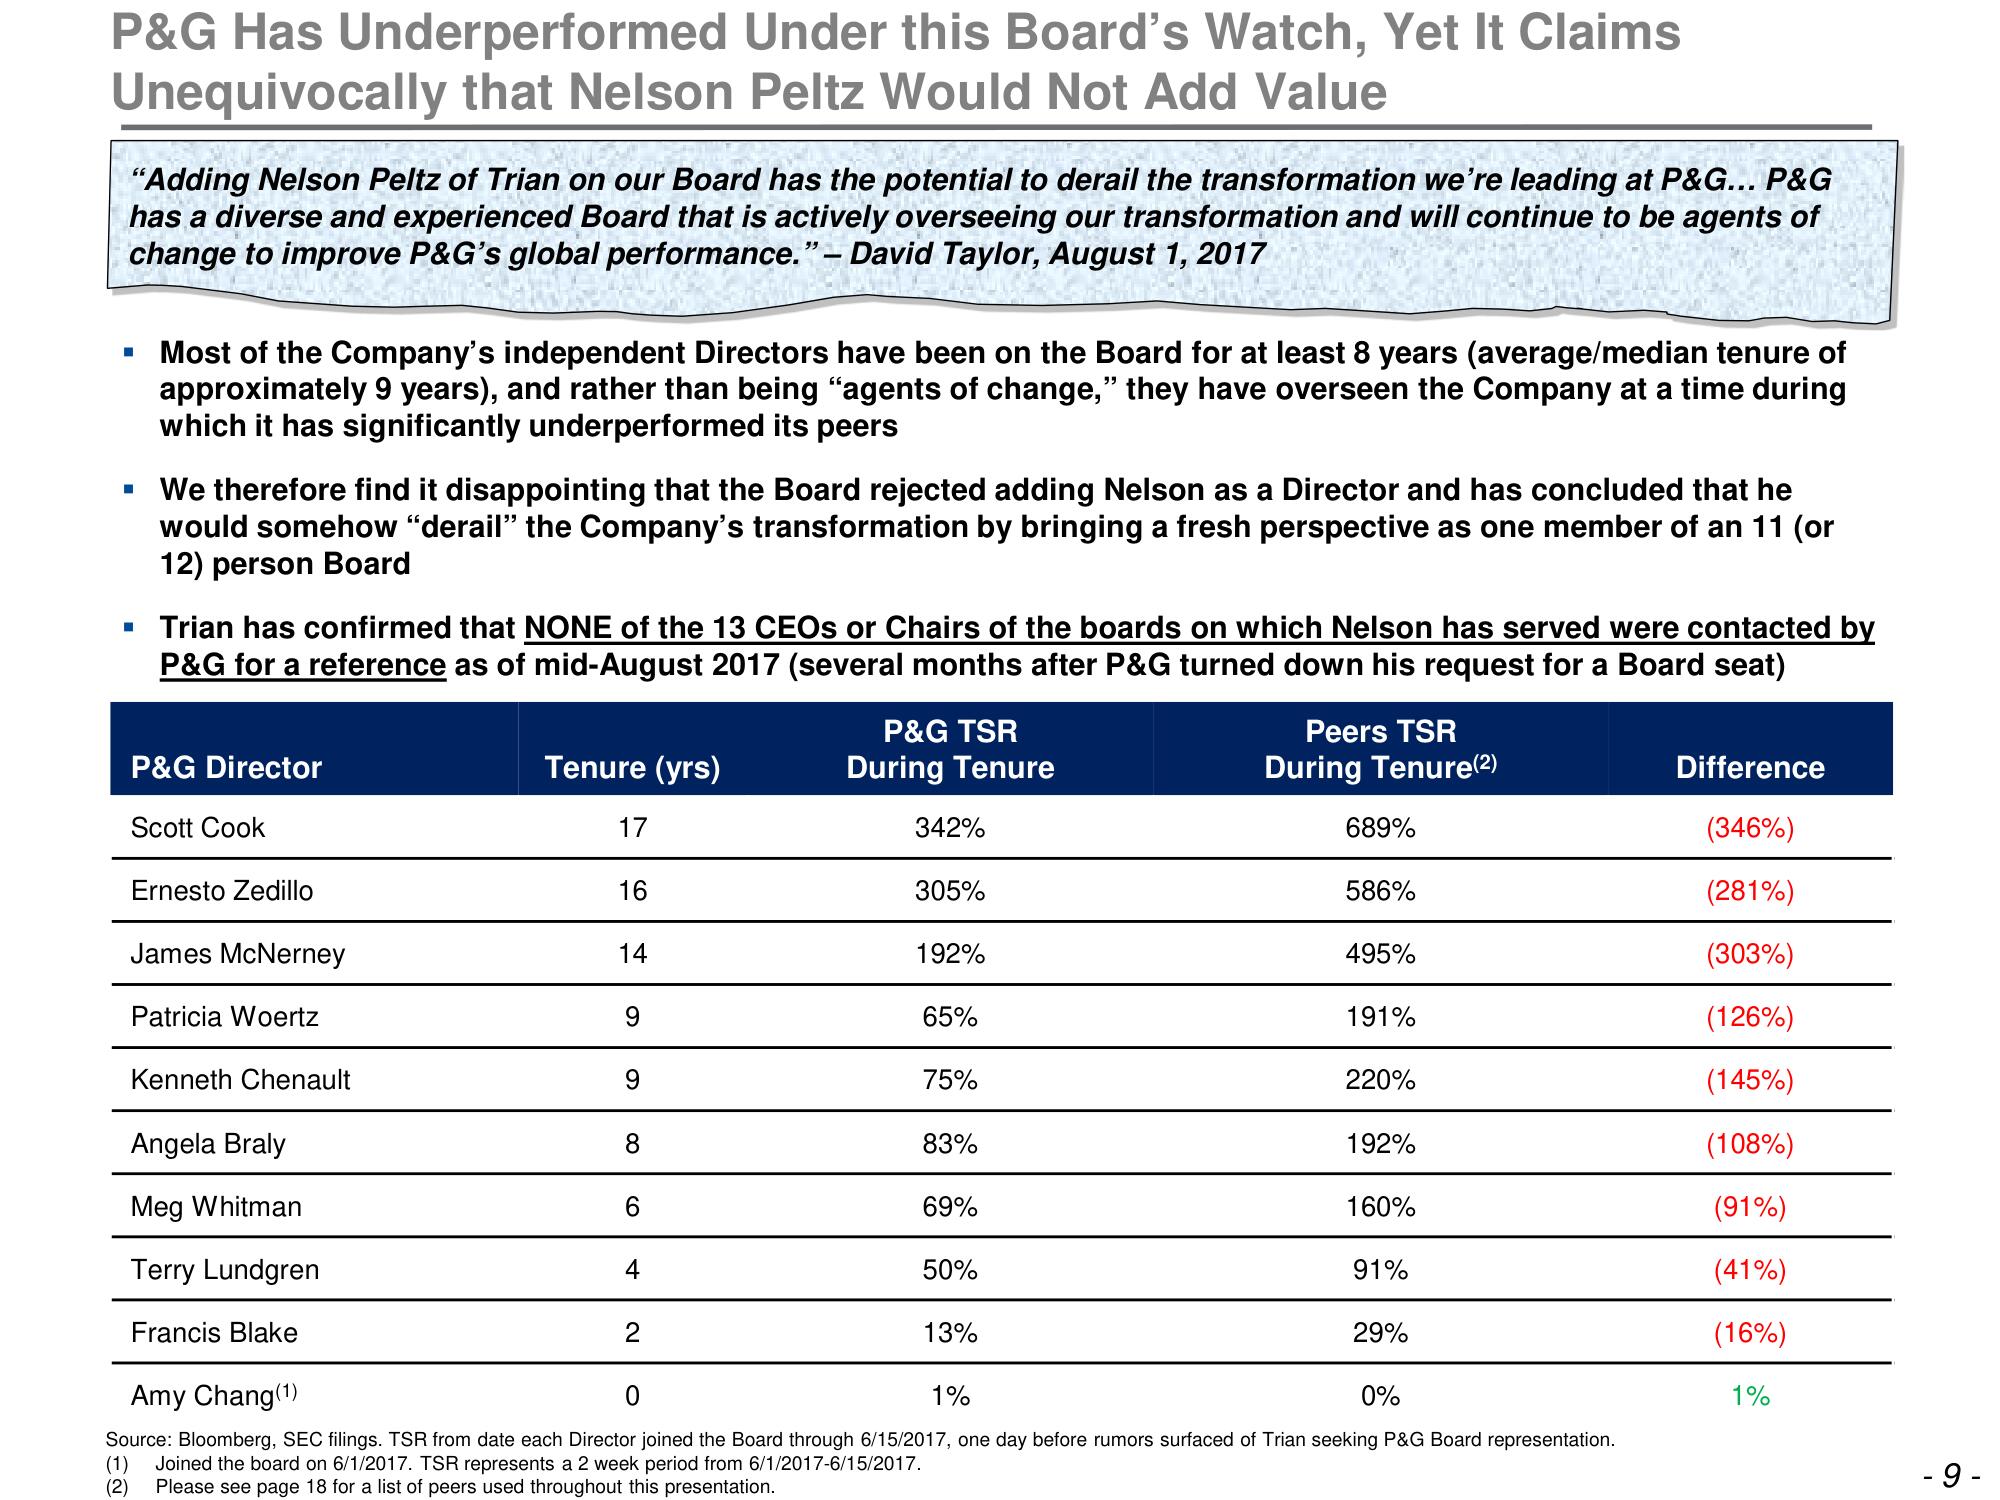
Most of the Company's independent Directors have been on the Board for at least 8 years (average/median tenure of
approximately 9 years), and rather than being "agents of change," they have overseen the Company at a time during
which it has significantly underperformed its peers
▪ We therefore find it disappointing that the Board rejected adding Nelson as a Director and has concluded that he
would somehow "derail" the Company's transformation by bringing a fresh perspective as one member of an 11 (or
12) person Board
▪ Trian has confirmed that NONE of the 13 CEOs or Chairs of the boards on which Nelson has served were contacted by
P&G for a reference as of mid-August 2017 (several months after P&G turned down his request for a Board seat)
P&G Director
Scott Cook
Ernesto Zedillo
James McNerney
Patricia Woertz
Kenneth Chenault
Angela Braly
Meg Whitman
Terry Lundgren
Francis Blake
Tenure (yrs)
17
16
14
9
9
8
6
4
2
P&G TSR
During Tenure
342%
305%
192%
65%
75%
83%
69%
50%
13%
Peers TSR
During Tenure (2)
689%
586%
495%
191%
220%
192%
160%
91%
29%
Amy Chang (1)
0
1%
0%
Source: Bloomberg, SEC filings. TSR from date each Director joined the Board through 6/15/2017, one day before rumors surfaced of Trian seeking P&G Board representation.
(1) Joined the board on 6/1/2017. TSR represents a 2 week period from 6/1/2017-6/15/2017.
(2)
Please see page 18 for a list of peers used throughout this presentation.
Difference
(346%)
(281%)
(303%)
(126%)
(145%)
(108%)
(91%)
(41%)
(16%)
1%
- 9-View entire presentation