Bank of America Investment Banking Pitch Book
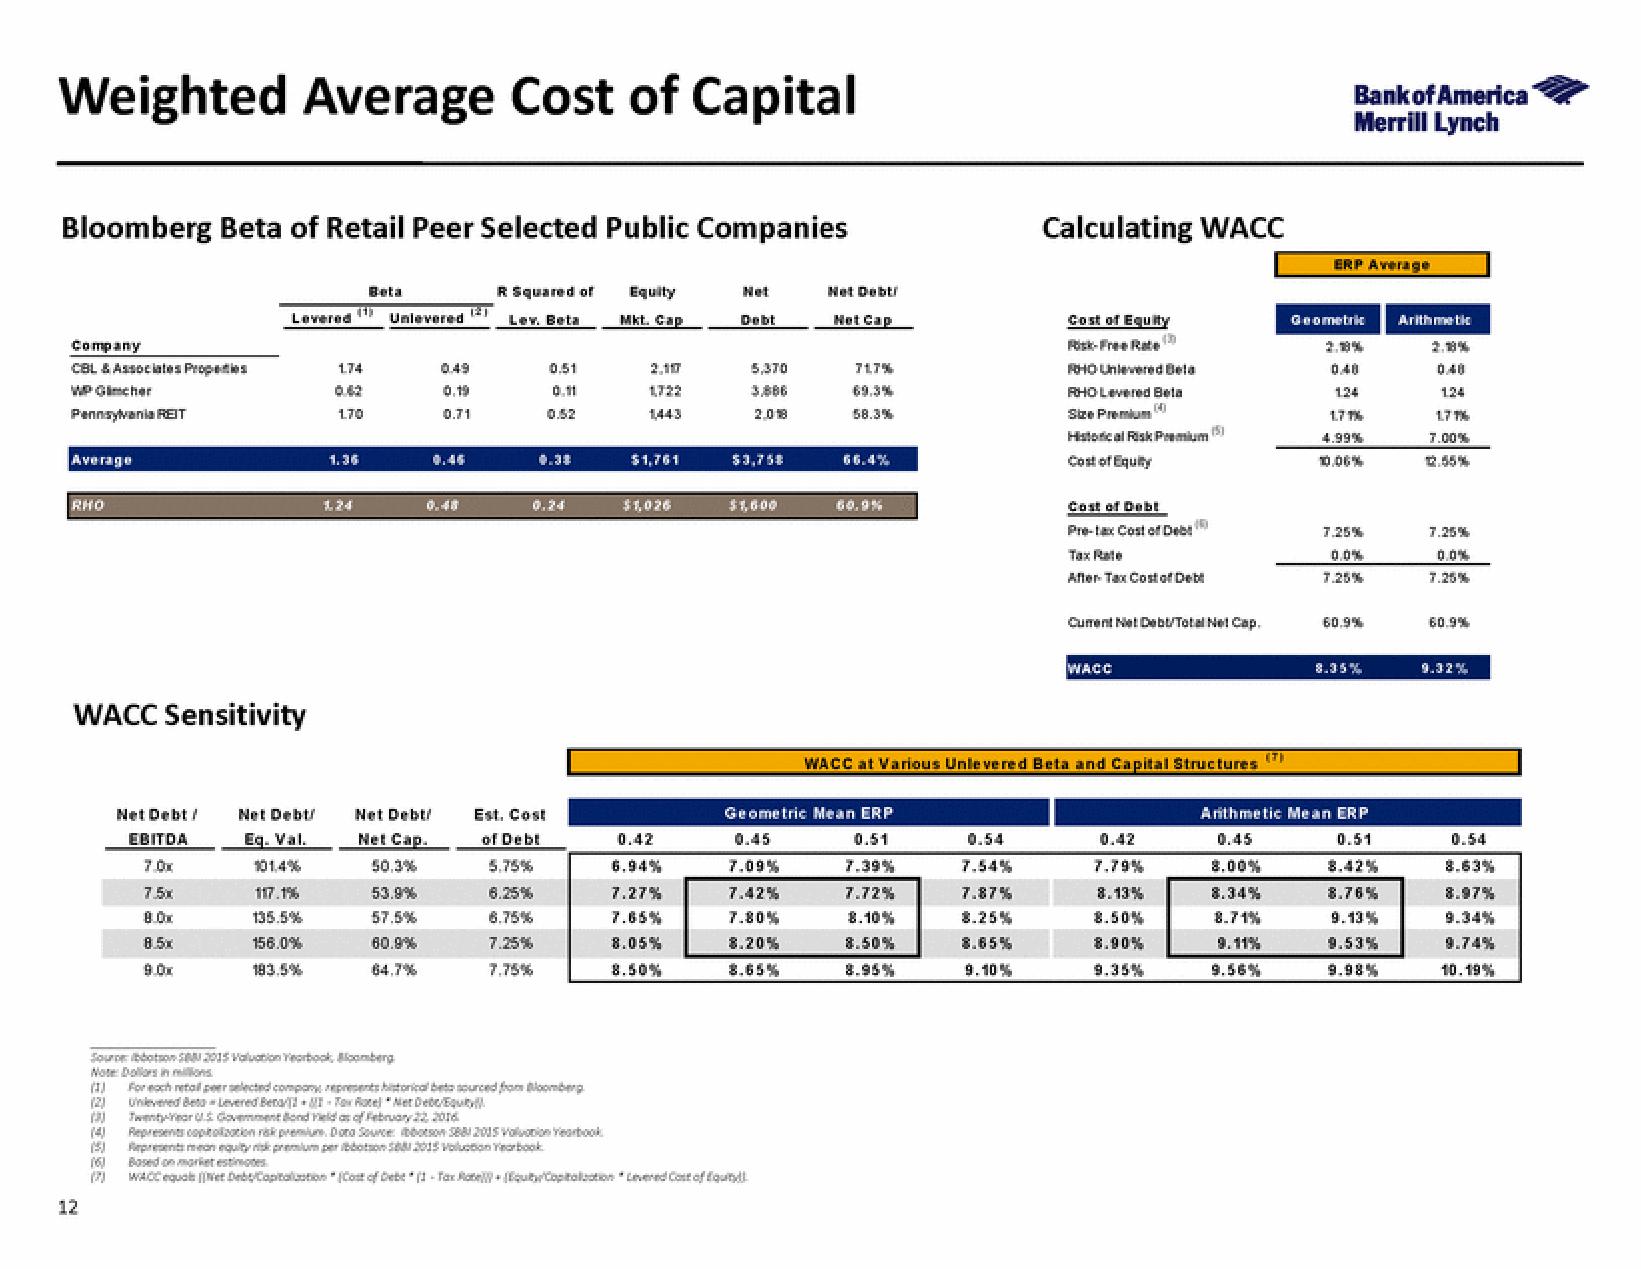
Weighted Average Cost of Capital
Bloomberg Beta of Retail Peer Selected Public Companies
Equity
Mkt. Cap
Company
CBL & Associates Properties
WP Gimcher
Pennsylvania REIT
Average
RHO
WACC Sensitivity
12
Levered
Net Debt/
EBITDA
7.0x
7.5x
8.0x
8.5x
9.0x
1:30
(4)
(5)
16)
(7)
Net Debt/
Eq. Val.
101.4%
117.1%
135.5%
156.0%
183.5%
174
170
124
Beta
Unlevered
Sourbon 2015 Valuation Yearbook, Bloomberg
Note Dolors in milions
Net Debt/
Net Cap.
50.3%
53.9%
57.5%
60.9%
64.7%
0.48
121
0.19
0.71
R Squared of
Lev. Beta
6.75%
7.25%
7.75%
0.51
0.11
0.52
0.30
Est. Cost
of Debt
5.75%
0.24
(1) For each retailer selected company represents historical beta sourced from Bloomberg
Unlevered BetLevered Beta/Tow Rotel NetDecqu
Twentyr Government Bond Field as of February 22, 2016
Represents copolization rak premiue. Dora Source bbotson 881 2015 Volvonion Yearbook
Representen equity rik premium per boton 588 2015 Voluotobook
2.117
$1,761
$1,026
0.42
6.94%
7.27%
7.65%
8.05%
8.50%
Net
5,370
2.08
$3,758
$1,600
Based on market estimates
WACC equals(Net DebCapitation (Cost of Debt (1-Tax Rate Equity Capitaluation Levered Cost of foundl
0.45
7.09%
7.42%
7.80%
8.20%
8.65%
Net Debt
Net Cap
717%
69.3%
58.3%
Geometric Mean ERP
0.51
7.39%
7.72%
8.10%
8.50%
Calculating WACC
0.54
7.54%
7.87%
8.25%
8.85%
9.10%
Cost of Equity
ROHO Unlevered Beta
RHO Levered Beta
Size Premium
Historical Risk Premium (5)
Cost of Equity
Cost of Debt
Pre-tax Cost of Debt
Tax Rate
After Tax Cost of Debt
10
Cument Net Debt/Total Ne! Cap.
WACC
WACC at Various Unlevered Beta and Capital Structures (™)
0.42
7.79%
8.13%
8.50%
8.90%
9.35%
Bank of America
Merrill Lynch
ERP Average
Geometric
2.18%
0.48
124
1.77%
4.99%
10.06%
7.25%
0.0%
7.25%
8.35%
Arithmetic Mean ERP
0.45
0.51
8.00%
8.34%
8.71%
9.11%
9.56%
8.42%
8.76%
9.13%
9.53%
Arithmetic
2.18%
0.48
124
1.77%
7.00%
12.55%
7.25%
0.0%
7.25%
60.9%
9.32%
0.54
8.63%
8.97%
9.34%
9.74%
10.19%View entire presentation