HPS Specialty Loan Fund VI
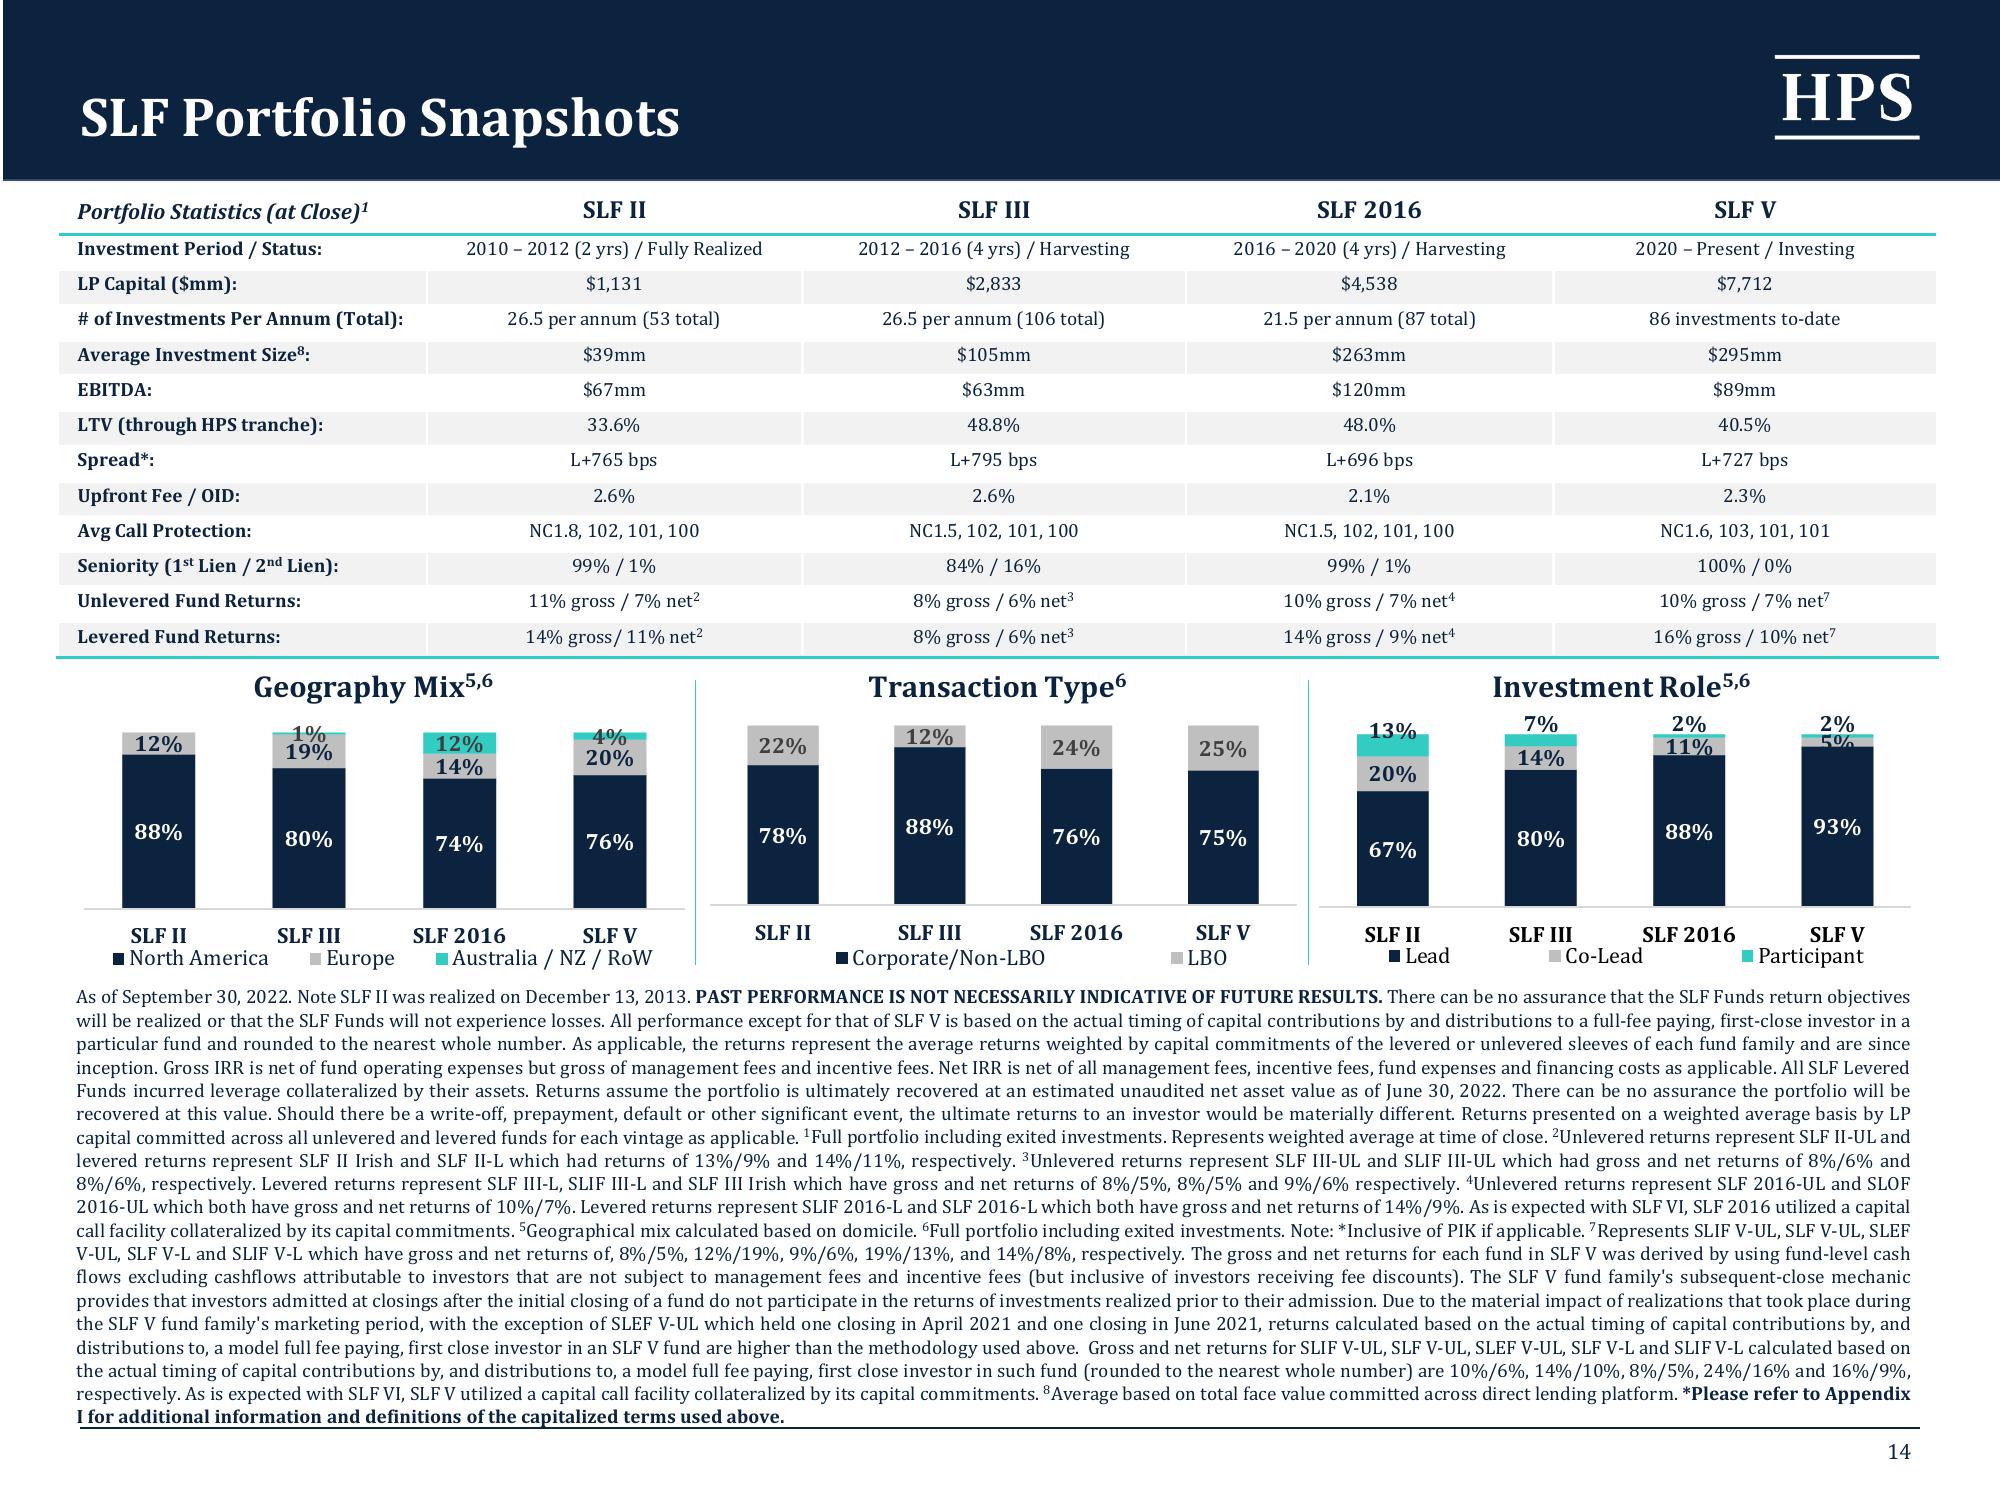
SLF Portfolio Snapshots
Portfolio Statistics (at Close)¹
Investment Period / Status:
LP Capital ($mm):
# of Investments Per Annum (Total):
Average Investment Size:
EBITDA:
LTV (through HPS tranche):
Spread*:
Upfront Fee / OID:
Avg Call Protection:
Seniority (1st Lien / 2nd Lien):
Unlevered Fund Returns:
Levered Fund Returns:
12%
88%
Geography Mix5,6
1%
19%
SLF II
2010-2012 (2 yrs) / Fully Realized
$1,131
26.5 per annum (53 total)
$39mm
$67mm
33.6%
L+765 bps
2.6%
NC1.8, 102, 101, 100
99% / 1%
11% gross / 7% net²
14% gross/11% net²
80%
12%
14%
74%
4%
20%
76%
22%
SLF 2016
SLF V
■Australia / NZ / RoW
78%
SLF II
SLF III
2012-2016 (4 yrs) / Harvesting
$2,833
26.5 per annum (106 total)
$105mm
$63mm
48.8%
L+795 bps
2.6%
NC1.5, 102, 101, 100
84% / 16%
8% gross / 6% net³
8% gross / 6% net³
Transaction Type6
12%
88%
SLF III
Corporate/Non-LBO
24%
76%
SLF 2016
SLF 2016
2016-2020 (4 yrs) / Harvesting
$4,538
21.5 per annum (87 total)
$263mm
$120mm
48.0%
L+696 bps
25%
75%
SLF V
LBO
2.1%
NC1.5, 102, 101, 100
99% / 1%
10% gross / 7% net¹
14% gross/9% net4
13%
20%
67%
SLF II
■Lead
7%
14%
Investment Role5,6
2%
11%
80%
SLF V
2020 Present / Investing
$7,712
86 investments to-date
$295mm
$89mm
40.5%
L+727 bps
SLF III
Co-Lead
SLF II
SLF III
North America ■ Europe
As of September 30, 2022. Note SLF II was realized on December 13, 2013. PAST PERFORMANCE IS NOT NECESSARILY INDICATIVE OF FUTURE RESULTS. There can be no assurance that the SLF Funds return objectives
will be realized or that the SLF Funds will not experience losses. All performance except for that of SLF V is based on the actual timing of capital contributions by and distributions to a full-fee paying, first-close investor in a
particular fund and rounded to the nearest whole number. As applicable, the returns represent the average returns weighted by capital commitments of the levered or unlevered sleeves of each fund family and are since
inception. Gross IRR is net of fund operating expenses but gross of management fees and incentive fees. Net IRR is net of all management fees, incentive fees, fund expenses and financing costs as applicable. All SLF Levered
Funds incurred leverage collateralized by their assets. Returns assume the portfolio is ultimately recovered at an estimated unaudited net asset value as of June 30, 2022. There can be no assurance the portfolio will be
recovered at this value. Should there be a write-off, prepayment, default or other significant event, the ultimate returns to an investor would be materially different. Returns presented on a weighted average basis by LP
capital committed across all unlevered and levered funds for each vintage as applicable. ¹Full portfolio including exited investments. Represents weighted average at time of close. 2Unlevered returns represent SLF II-UL and
levered returns represent SLF II Irish and SLF II-L which had returns of 13%/9% and 14% / 11%, respectively. Unlevered returns represent SLF III-UL and SLIF III-UL which had gross and net returns of 8%/6% and
8%/6%, respectively. Levered returns represent SLF III-L, SLIF III-L and SLF III Irish which have gross and net returns of 8% / 5%, 8%/5% and 9% / 6% respectively. Unlevered returns represent SLF 2016-UL and SLOF
2016-UL which both have gross and net returns of 10%/7%. Levered returns represent SLIF 2016-L and SLF 2016-L which both have gross and net returns of 14%/9%. As is expected with SLF VI, SLF 2016 utilized a capital
call facility collateralized by its capital commitments. 5Geographical mix calculated based on domicile. 6Full portfolio including exited investments. Note: *Inclusive of PIK if applicable. Represents SLIF V-UL, SLF V-UL, SLEF
V-UL, SLF V-L and SLIF V-L which have gross and net returns of, 8%/5%, 12% / 19%, 9%/6%, 19% / 13%, and 14% / 8%, respectively. The gross and net returns for each fund in SLF V was derived by using fund-level cash
flows excluding cashflows attributable to investors that are not subject to management fees and incentive fees (but inclusive of investors receiving fee discounts). The SLF V fund family's subsequent-close mechanic
provides that investors admitted at closings after the initial closing of a fund do not participate in the returns of investments realized prior to their admission. Due to the material impact of realizations that took place during
the SLF V fund family's marketing period, with the exception of SLEF V-UL which held one closing in April 2021 and one closing in June 2021, returns calculated based on the actual timing of capital contributions by, and
distributions to, a model full fee paying, first close investor in an SLF V fund are higher than the methodology used above. Gross and net returns for SLIF V-UL, SLF V-UL, SLEF V-UL, SLF V-L and SLIF V-L calculated based on
the actual timing of capital contributions by, and distributions to, a model full fee paying, first close investor in such fund (rounded to the nearest whole number) are 10%/6%, 14%/10%, 8%/5%, 24%/16% and 16%/9%,
respectively. As is expected with SLF VI, SLF V utilized a capital call facility collateralized by its capital commitments. Average based on total face value committed across direct lending platform. *Please refer to Appendix
I for additional information and definitions of the capitalized terms used above.
2.3%
NC1.6, 103, 101, 101
100% / 0%
10% gross / 7% net7
16% gross / 10% net7
HPS
88%
SLF 2016
2%
5%
93%
SLF V
Participant
14View entire presentation