Grab Results Presentation Deck
Q2 2023 Results
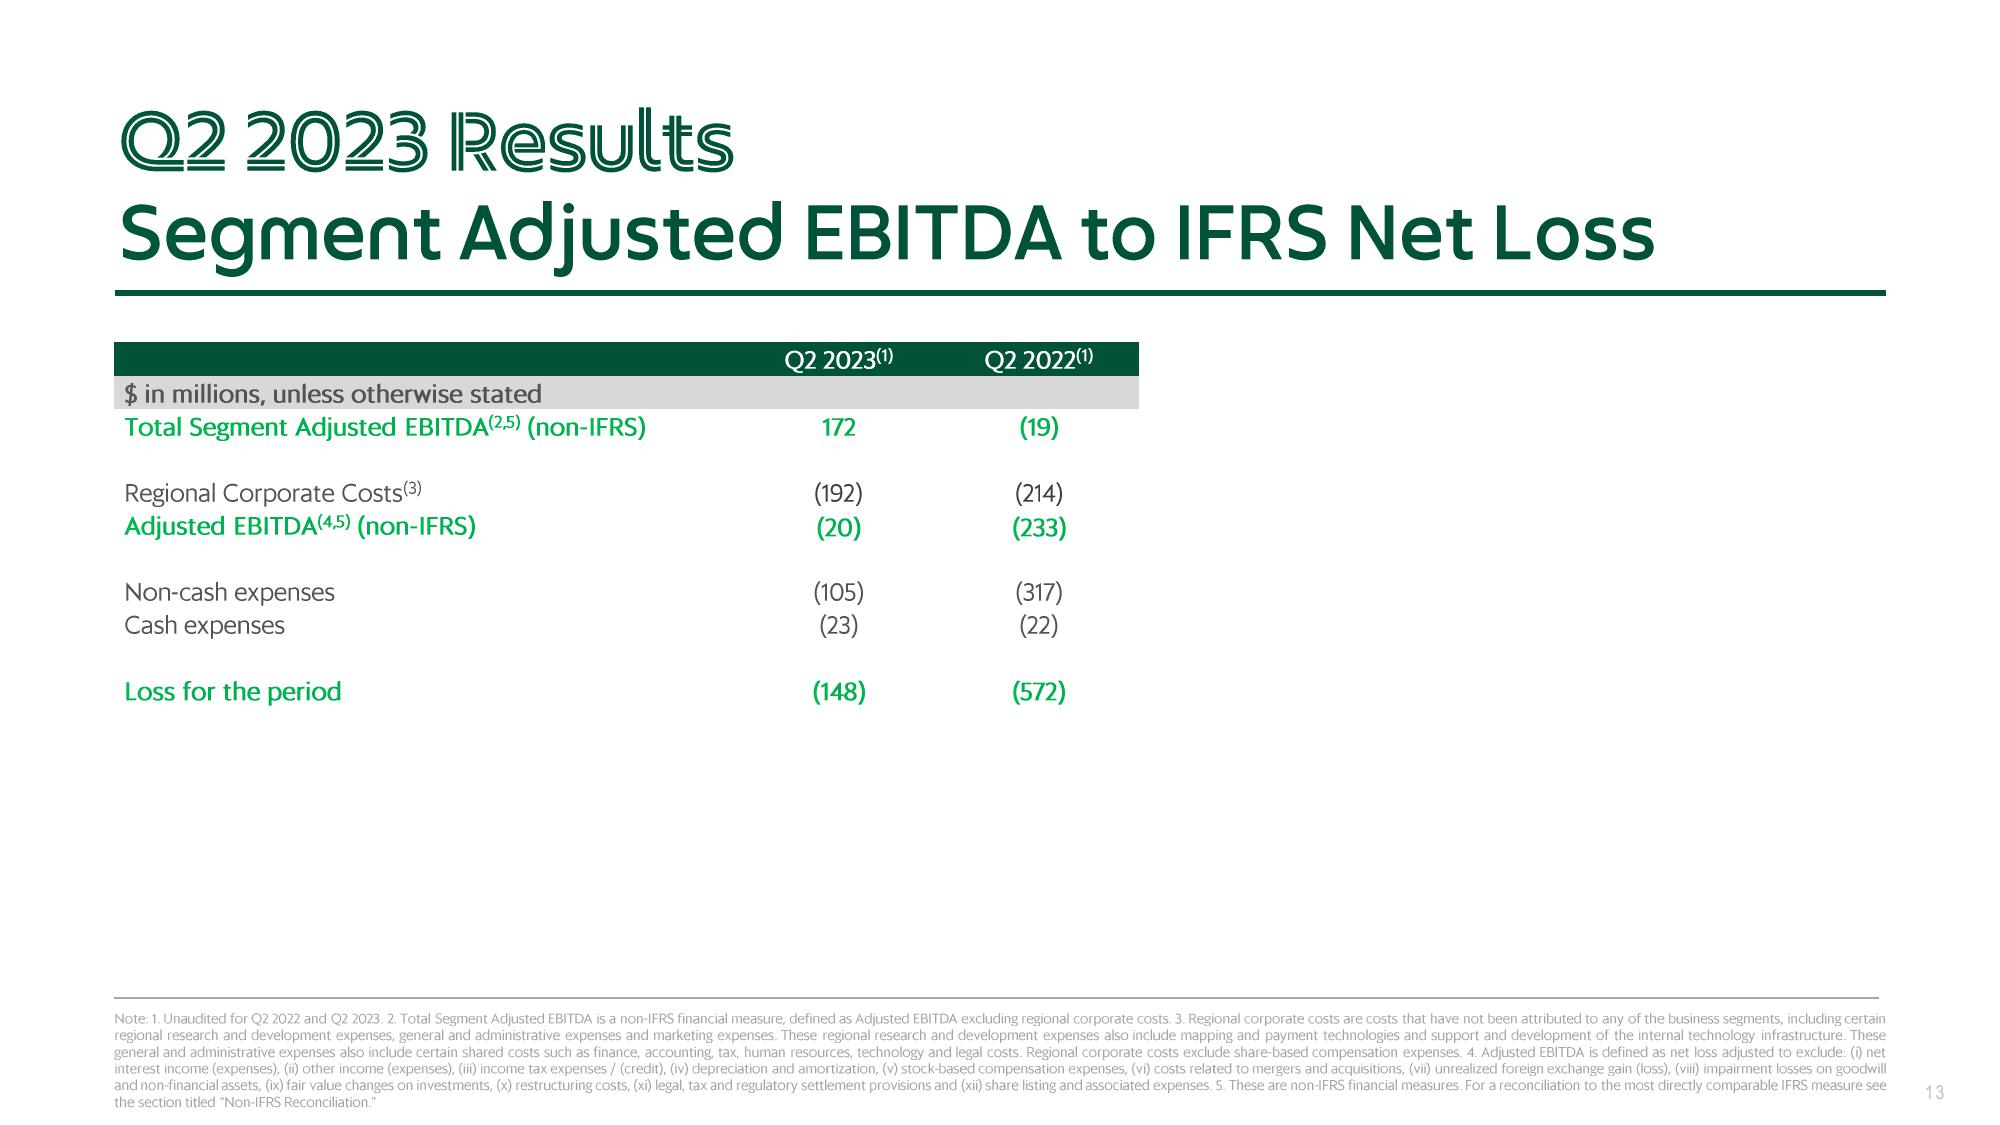
Segment Adjusted EBITDA to IFRS Net Loss
$ in millions, unless otherwise stated
Total Segment Adjusted EBITDA(2,5) (non-IFRS)
Regional Corporate Costs(3)
Adjusted EBITDA(4.5) (non-IFRS)
Non-cash expenses
Cash expenses
Loss for the period
Q2 2023(1)
172
(192)
(20)
(105)
(23)
(148)
Q2 2022(1)
(19)
(214)
(233)
(317)
(22)
(572)
Note: 1. Unaudited for Q2 2022 and Q2 2023. 2. Total Segment Adjusted EBITDA is a non-IFRS financial measure, defined as Adjusted EBITDA excluding regional corporate costs. 3. Regional corporate costs are costs that have not been attributed to any of the business segments, including certain
regional research and development expenses, general and administrative expenses and marketing expenses. These regional research and development expenses also include mapping and payment technologies and support and development of the internal technology infrastructure. These
general and administrative expenses also include certain shared costs such as finance, accounting, tax, human resources, technology and legal costs. Regional corporate costs exclude share-based compensation expenses. 4. Adjusted EBITDA is defined as net loss adjusted to exclude: (i) net
interest income (expenses), (ii) other income (expenses), (iii) income tax expenses/ (credit), (iv) depreciation and amortization, (v) stock-based compensation expenses, (vi) costs related to mergers and acquisitions, (vii) unrealized foreign exchange gain (loss), (viii) impairment losses on goodwill
and non-financial assets, (ix) fair value changes on investments, (x) restructuring costs, (xi) legal, tax and regulatory settlement provisions and (xii) share listing and associated expenses. 5. These are non-IFRS financial measures. For a reconciliation to the most directly comparable IFRS measure see
the section titled "Non-IFRS Reconciliation."
13View entire presentation