2011 and Fourth Quarter Results
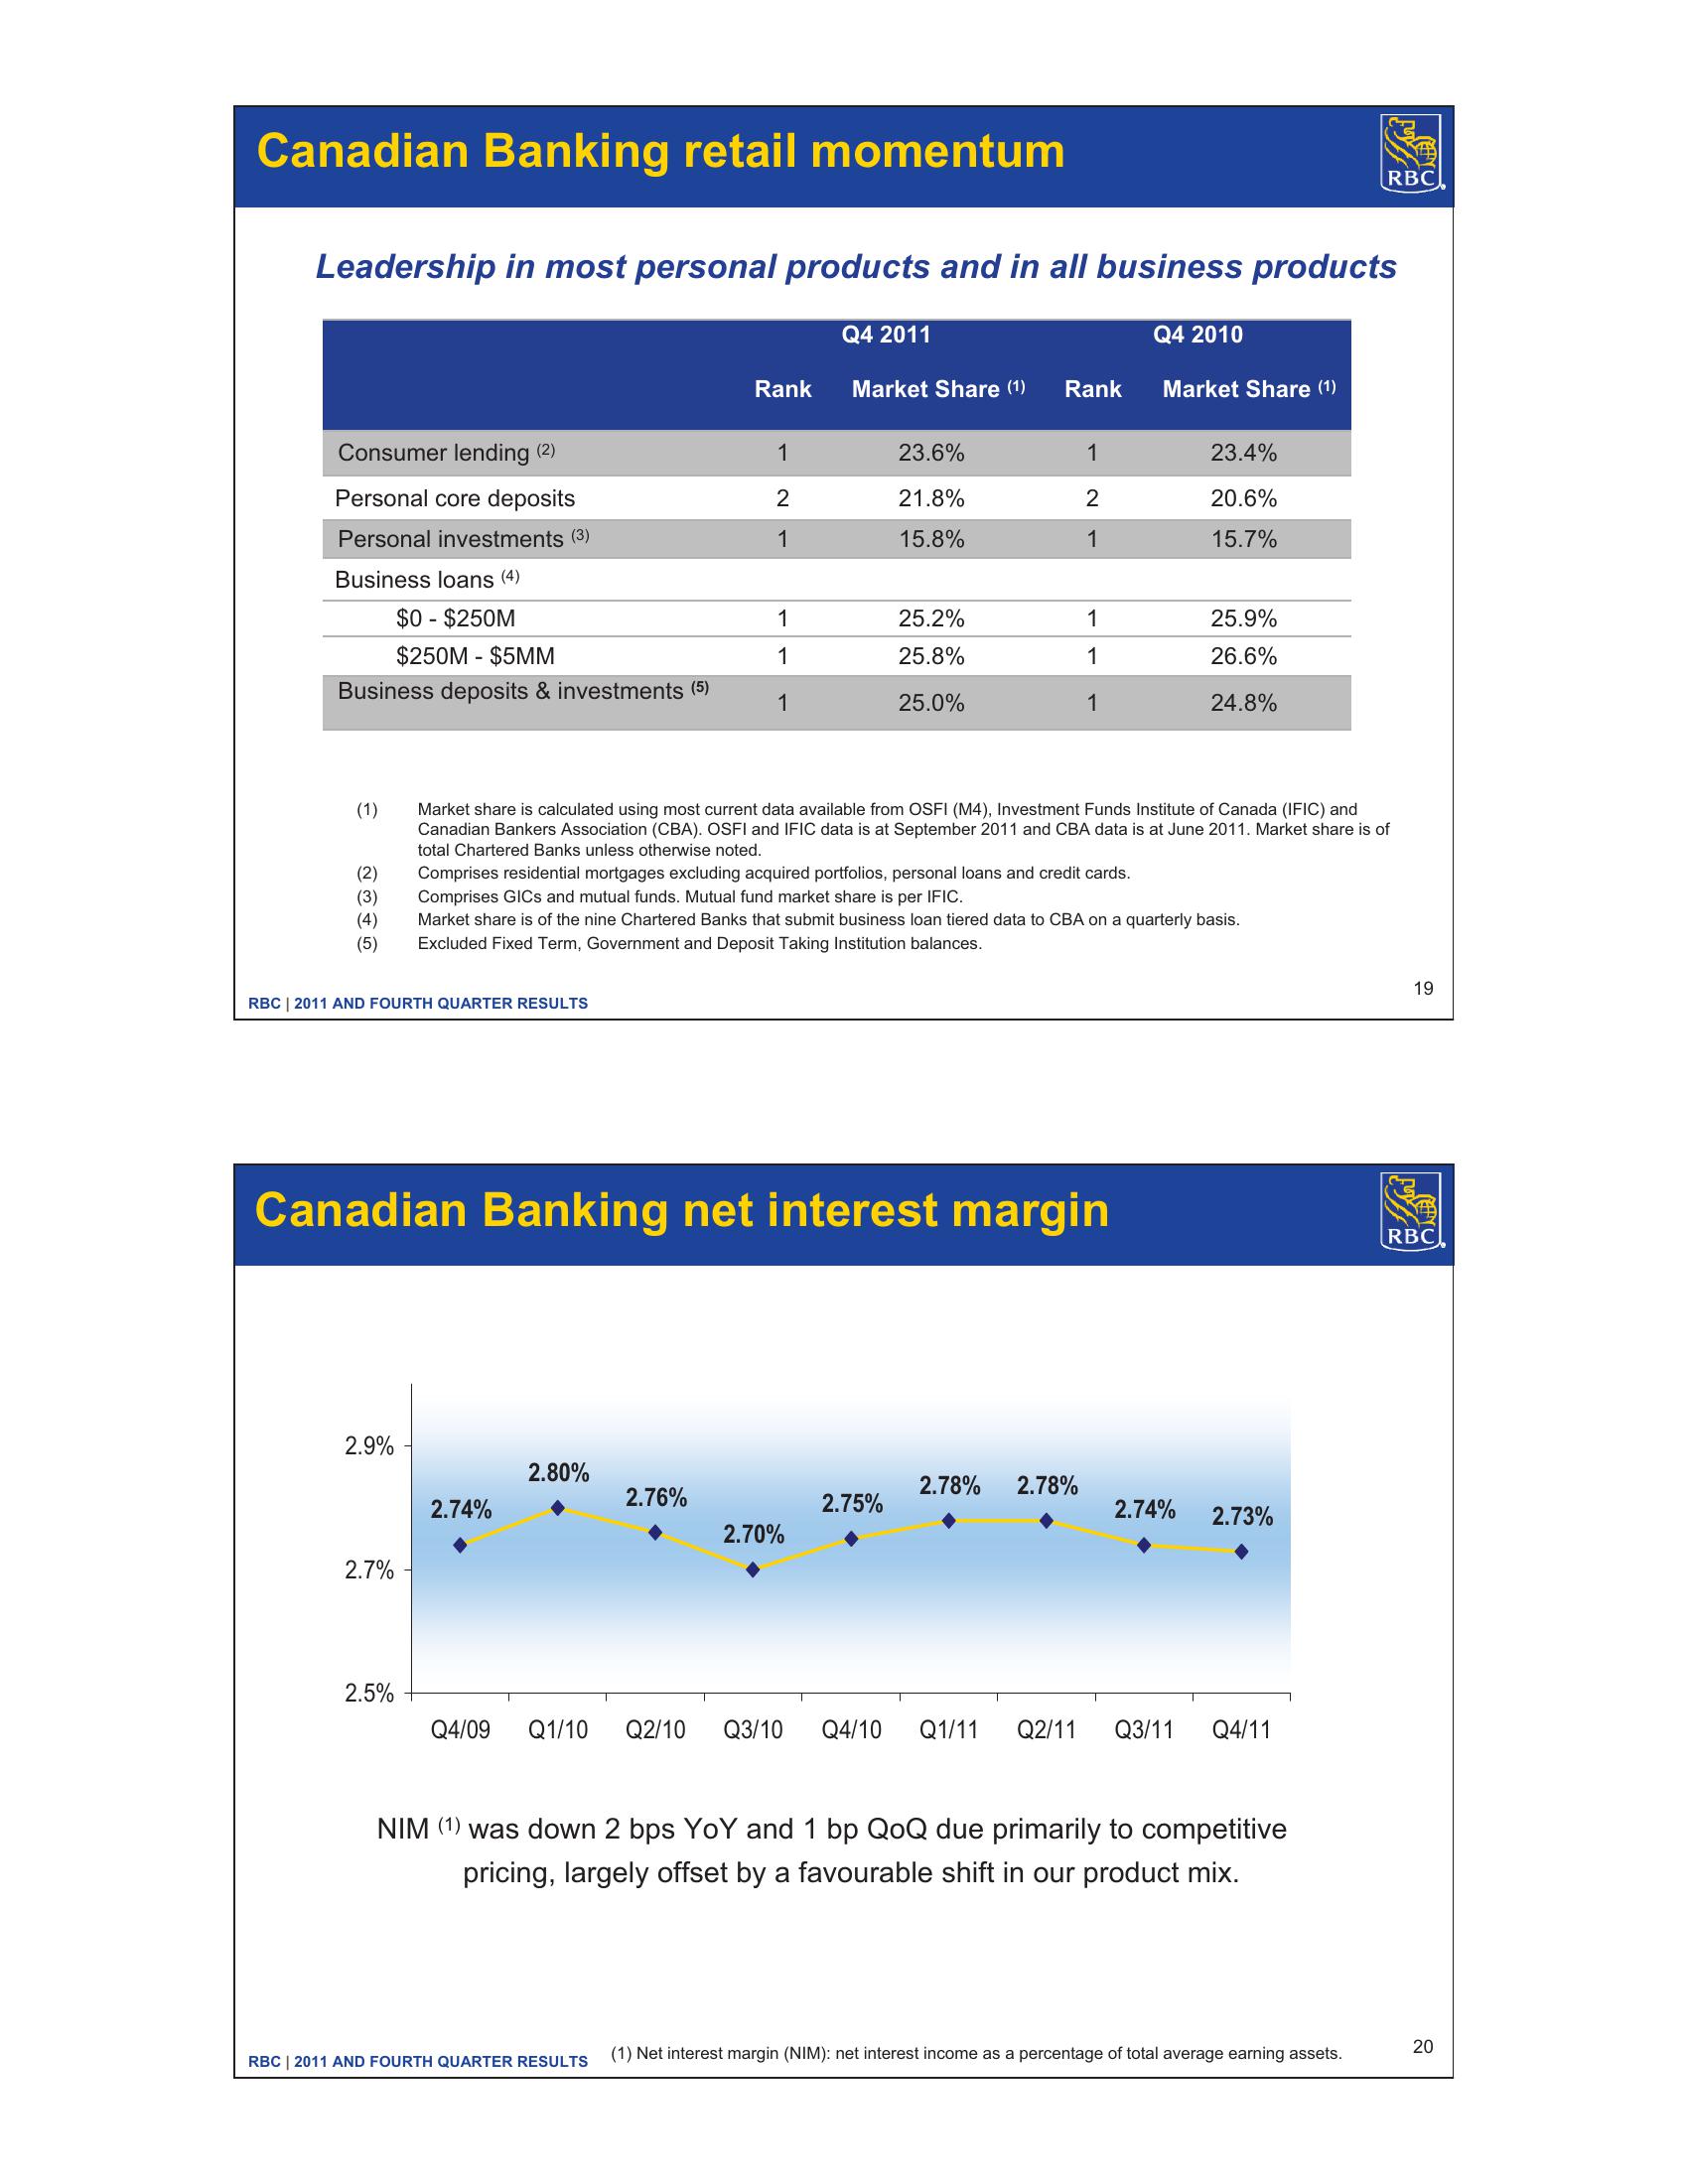
Canadian Banking retail momentum
Leadership in most personal products and in all business products
RBC
Q4 2011
Q4 2010
Rank
Market Share (1)
Rank
Market Share (1)
Consumer lending (2)
1
23.6%
1
23.4%
Personal core deposits
2
21.8%
2
20.6%
Personal investments (3)
1
15.8%
1
15.7%
Business loans (4)
$0 - $250M
1
25.2%
1
25.9%
$250M $5MM
1
25.8%
1
26.6%
Business deposits & investments (5)
1
25.0%
1
24.8%
(1)
Market share is calculated using most current data available from OSFI (M4), Investment Funds Institute of Canada (IFIC) and
Canadian Bankers Association (CBA). OSFI and IFIC data is at September 2011 and CBA data is at June 2011. Market share is of
total Chartered Banks unless otherwise noted.
GETN
(2)
Comprises residential mortgages excluding acquired portfolios, personal loans and credit cards.
(3)
Comprises GICs and mutual funds. Mutual fund market share is per IFIC.
(4)
(5)
Market share is of the nine Chartered Banks that submit business loan tiered data to CBA on a quarterly basis.
Excluded Fixed Term, Government and Deposit Taking Institution balances.
RBC 2011 AND FOURTH QUARTER RESULTS
Canadian Banking net interest margin
2.9%
2.80%
2.78% 2.78%
2.76%
2.74%
2.75%
2.74% 2.73%
2.70%
2.7%
2.5%
Q4/09 Q1/10 Q2/10 Q3/10 Q4/10 Q1/11 Q2/11 Q3/11 Q4/11
NIM (1) was down 2 bps YoY and 1 bp QoQ due primarily to competitive
pricing, largely offset by a favourable shift in our product mix.
19
RBC
20
(1) Net interest margin (NIM): net interest income as a percentage of total average earning assets.
RBC 2011 AND FOURTH QUARTER RESULTSView entire presentation