AMD Results Presentation Deck
APPENDICES
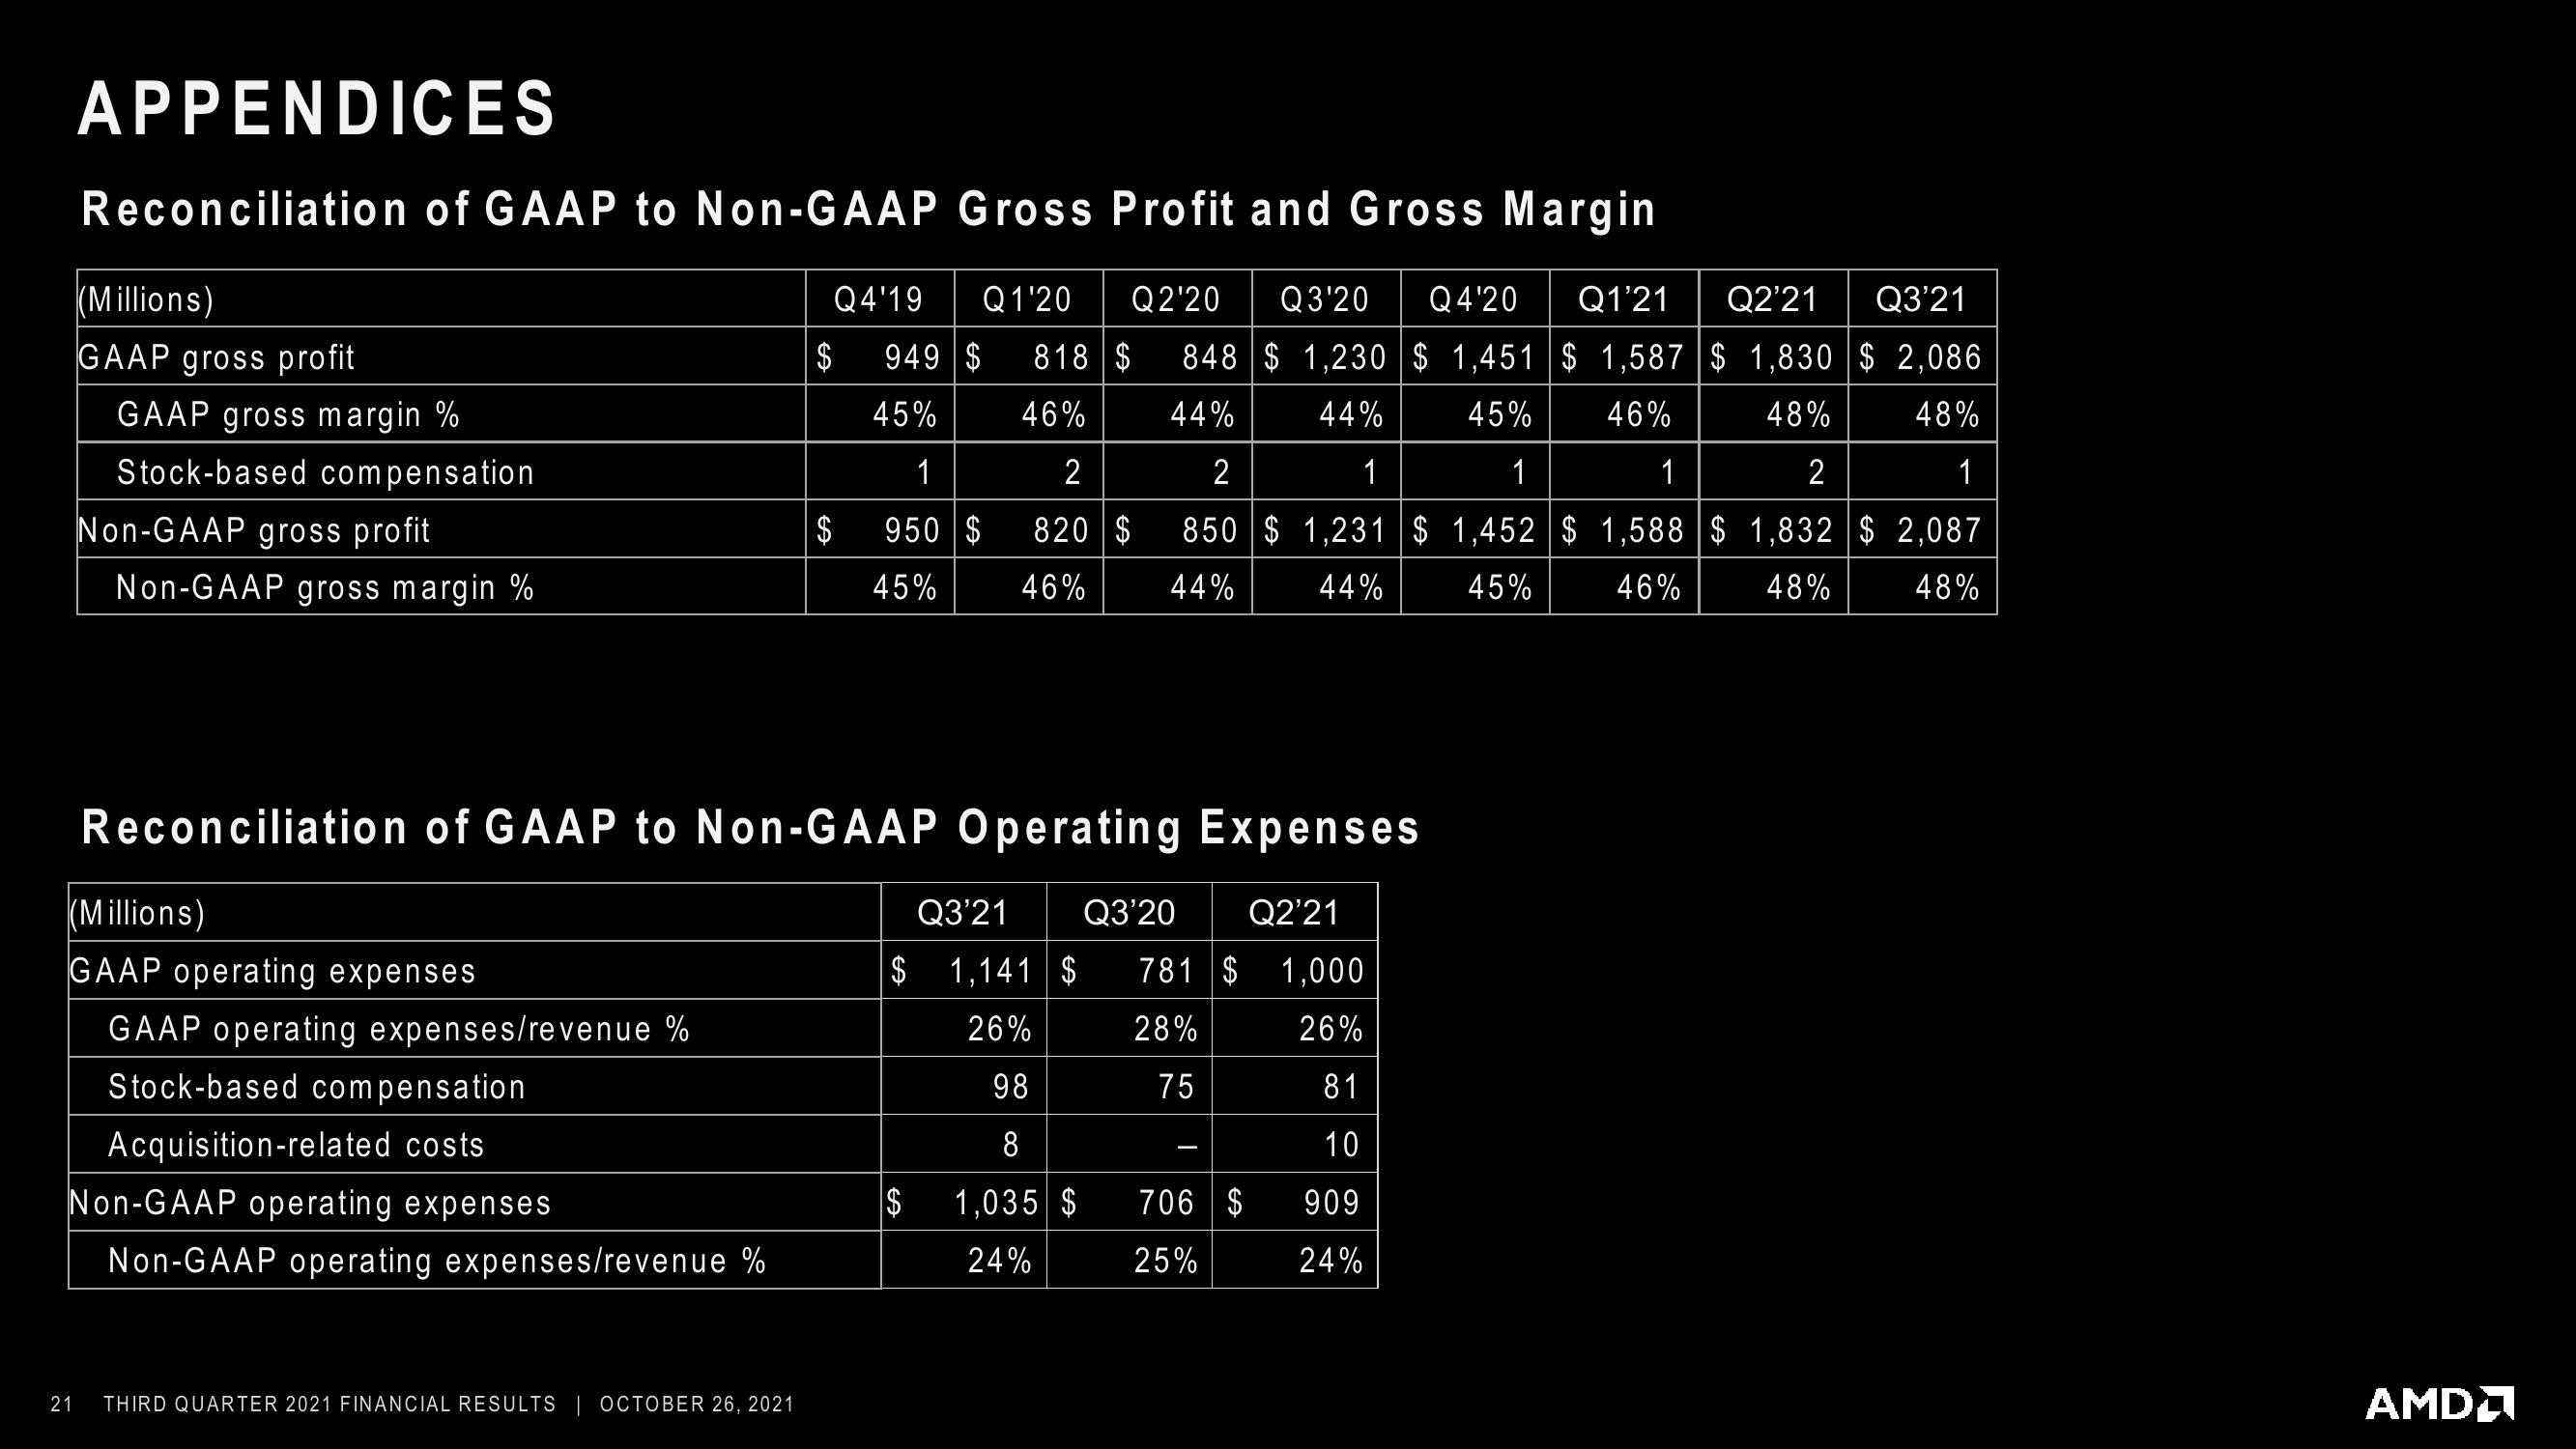
Reconciliation of GAAP to Non-GAAP Gross Profit and Gross Margin
(Millions)
GAAP gross profit
21
GAAP gross margin %
Stock-based compensation
Non-GAAP gross profit
Non-GAAP gross margin %
(Millions)
GAAP operating expenses
GAAP operating expenses/revenue %
Stock-based compensation
Acquisition-related costs
Non-GAAP operating expenses
Non-GAAP operating expenses/revenue %
Q4'19 Q1'20 Q2'20 Q3'20 Q4'20 Q1'21 Q2'21 Q3'21
818 $ 848 $ 1,230 $ 1,451 $ 1,587 $1,830 $ 2,086
$
46%
44%
44%
45% 46%
48%
48%
2
1
1
1
2
1
2
820 $ 850 $ 1,231 $ 1,452 $ 1,588 $ 1,832 $2,087
46%
44%
44%
45%
46%
48%
48%
Reconciliation of GAAP to Non-GAAP Operating Expenses
Q3'21 Q3'20 Q2'21
$1,141 $ 781 $ 1,000
28%
26%
75
81
10
909
24%
THIRD QUARTER 2021 FINANCIAL RESULTS | OCTOBER 26, 2021
949 $
45%
1
$ 950 $
45%
26%
98
8
$ 1,035 $
24%
706 $
25%
AMDView entire presentation