Sonos Results Presentation Deck
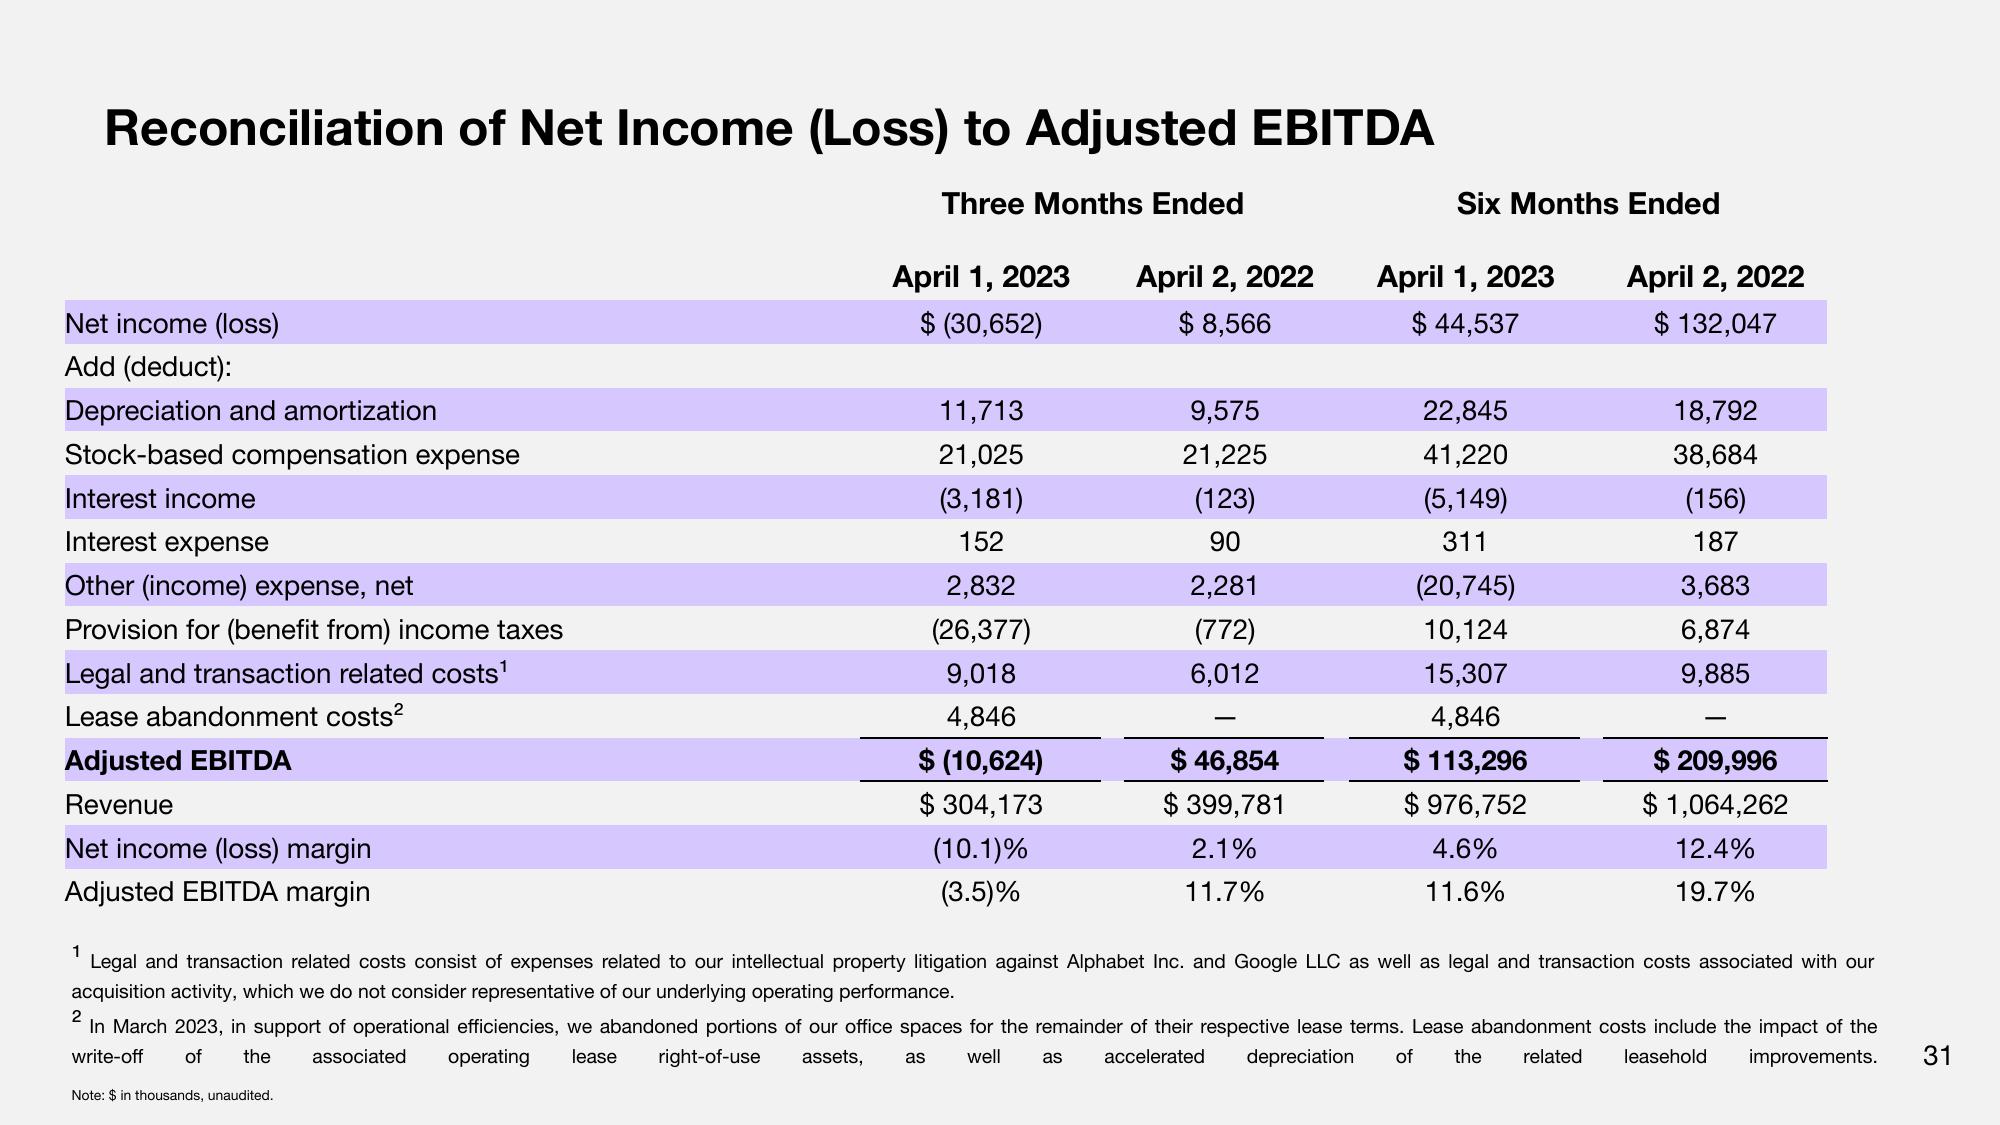
Reconciliation of Net Income (Loss) to Adjusted EBITDA
Three Months Ended
Net income (loss)
Add (deduct):
Depreciation and amortization
Stock-based compensation expense
Interest income
Interest expense
Other (income) expense, net
Provision for (benefit from) income taxes
Legal and transaction related costs¹
Lease abandonment costs²
Adjusted EBITDA
Revenue
Net income (loss) margin
Adjusted EBITDA margin
April 1, 2023
$ (30,652)
11,713
21,025
(3,181)
152
Note: $ in thousands, unaudited.
2,832
(26,377)
9,018
4,846
$ (10,624)
$ 304,173
(10.1)%
(3.5)%
April 2, 2022
$ 8,566
9,575
21,225
(123)
90
2,281
(772)
6,012
$ 46,854
$ 399,781
2.1%
11.7%
Six Months Ended
April 1, 2023
$ 44,537
22,845
41,220
(5,149)
311
(20,745)
10,124
15,307
4,846
$ 113,296
$ 976,752
4.6%
11.6%
April 2, 2022
$ 132,047
18,792
38,684
(156)
187
3,683
6,874
9,885
$ 209,996
$ 1,064,262
12.4%
19.7%
1
Legal and transaction related costs consist of expenses related to our intellectual property litigation against Alphabet Inc. and Google LLC as well as legal and transaction costs associated with our
acquisition activity, which we do not consider representative of our underlying operating performance.
2
In March 2023, in support of operational efficiencies, we abandoned portions of our office spaces for the remainder of their respective lease terms. Lease abandonment costs include the impact of the
write-off of the associated operating lease right-of-use assets, as well as accelerated depreciation of the related leasehold improvements. 31View entire presentation