LSE Investor Presentation Deck
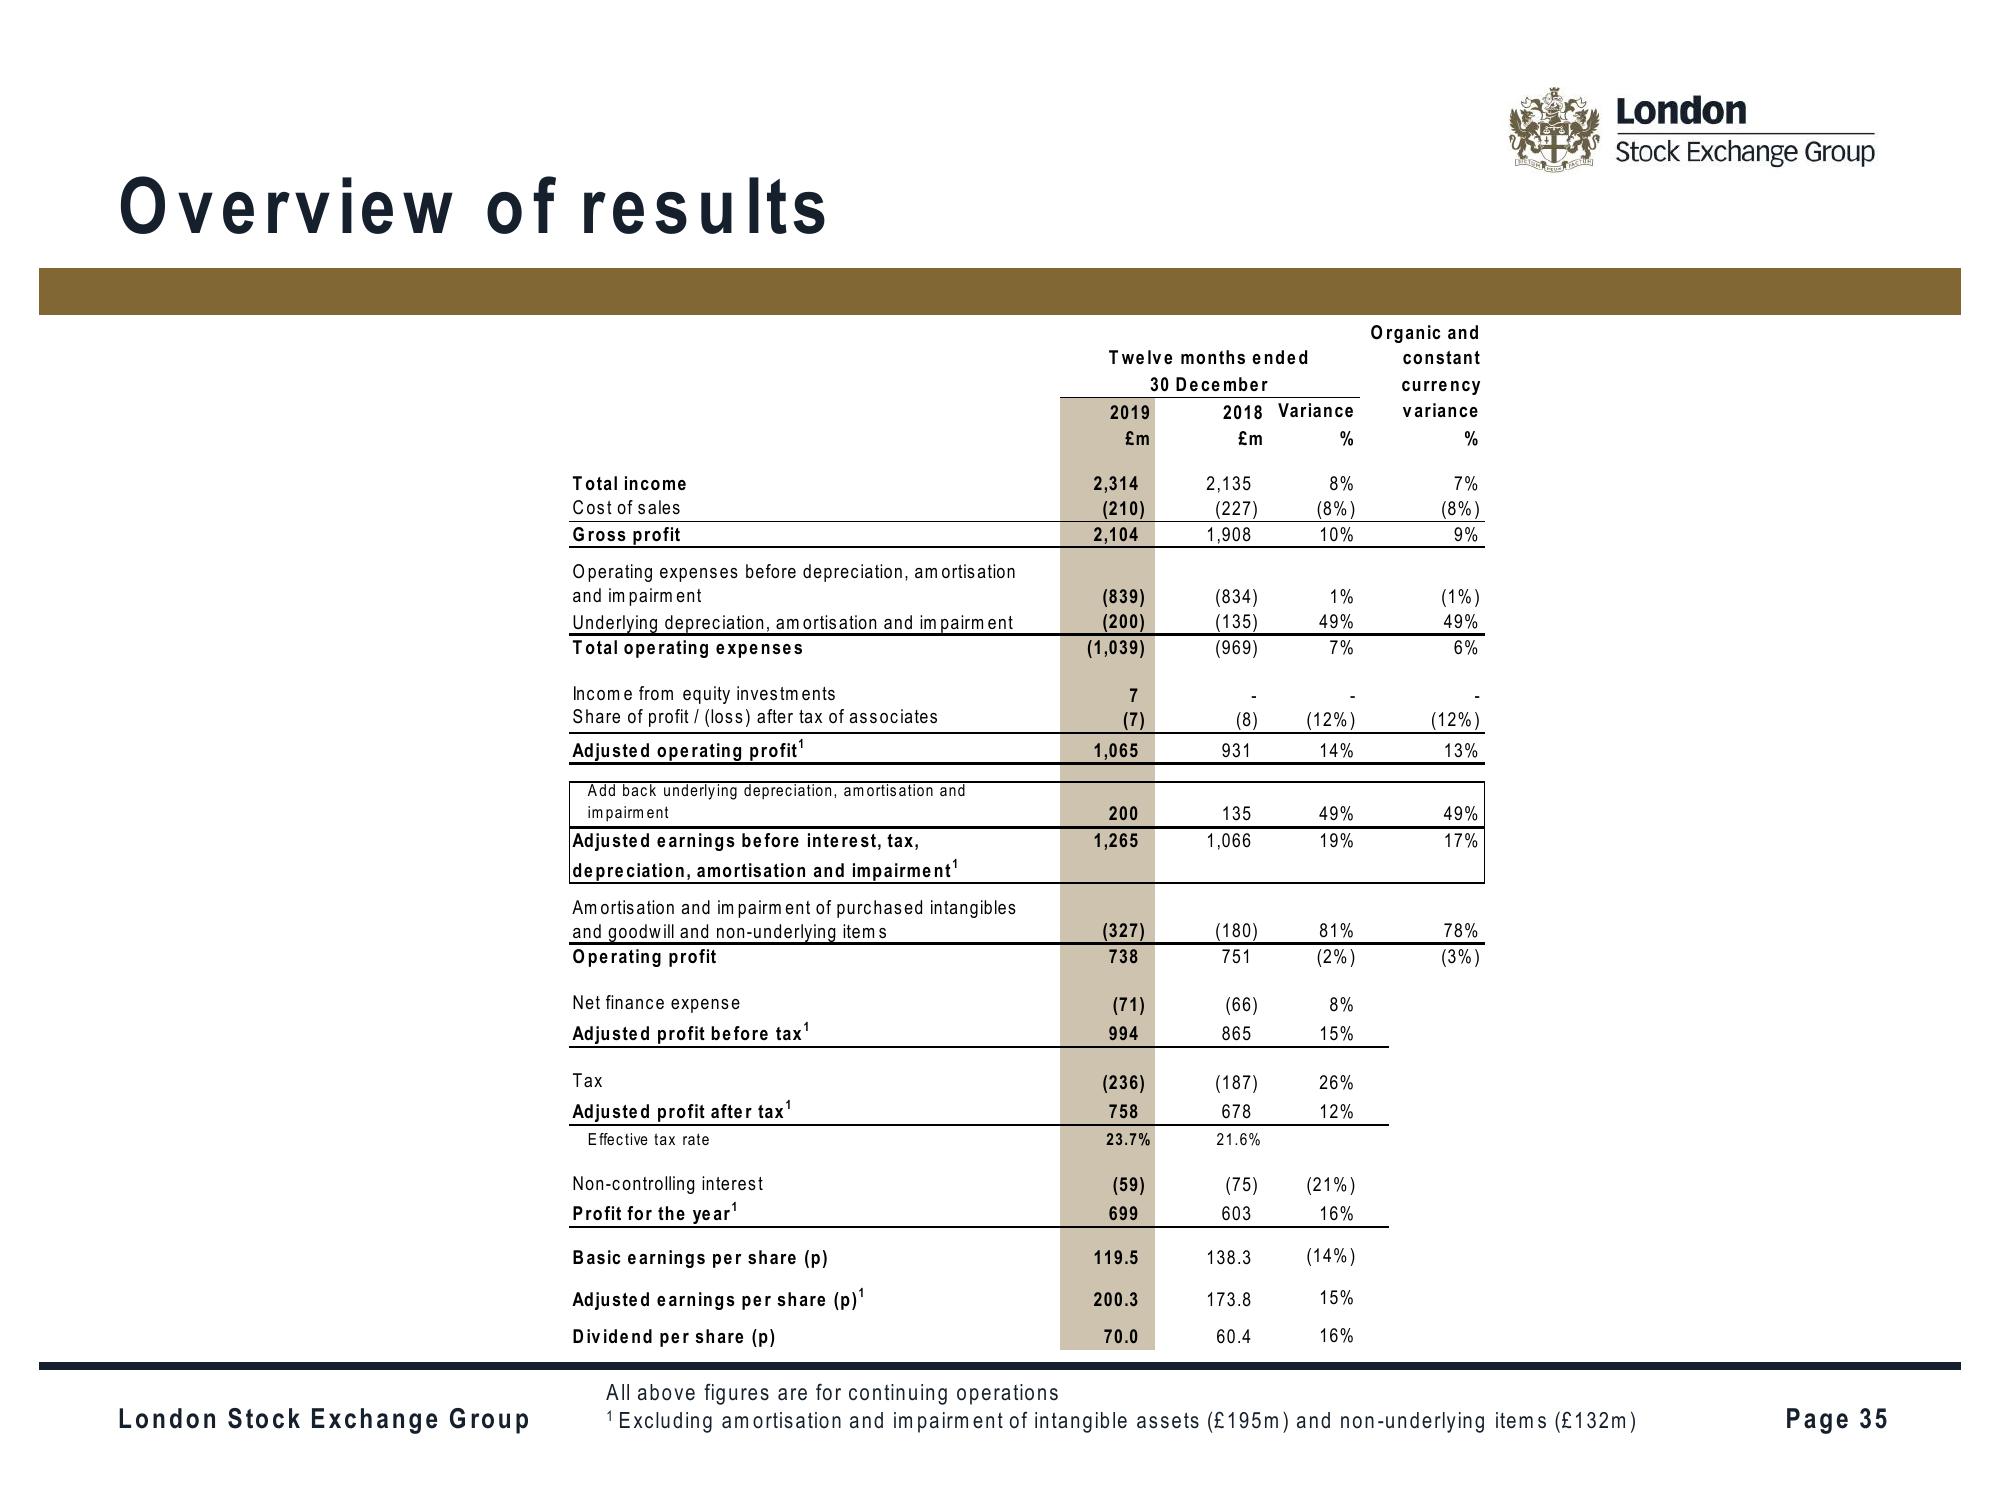
Overview of results
London Stock Exchange Group
Total income
Cost of sales
Gross profit
Operating expenses before depreciation, amortisation
and impairment
Underlying depreciation, amortisation and impairment
Total operating expenses
Income from equity investments
Share of profit/ (loss) after tax of associates
Adjusted operating profit¹
Add back underlying depreciation, amortisation and
impairment
Adjusted earnings before interest, tax,
depreciation, amortisation and impairment¹
Amortisation and impairment of purchased intangibles
and goodwill and non-underlying items
Operating profit
Net finance expense
Adjusted profit before tax¹
Tax
Adjusted profit after tax¹
Effective tax rate
Non-controlling interest
Profit for the year¹
Basic earnings per share (p)
Adjusted earnings per share (p)¹
Dividend per share (p)
Twelve months ended
30 December
2019
£m
2,314
(210)
2,104
(839)
(200)
(1,039)
7
(7)
1,065
200
1,265
(327)
738
(71)
994
(236)
758
23.7%
(59)
699
119.5
200.3
70.0
2018 Variance
£m
2,135
(227)
1,908
(834)
(135)
(969)
(8)
931
135
1,066
(180)
751
(66)
865
(187)
678
21.6%
(75)
603
138.3
173.8
60.4
%
8%
(8%)
10%
1%
49%
7%
(12%)
14%
49%
19%
81%
(2%)
8%
15%
26%
12%
(21%)
16%
(14%)
15%
16%
Organic and
constant
currency
variance
%
7%
(8%)
9%
(1%)
49%
6%
(12%)
13%
49%
17%
78%
(3%)
London
Stock Exchange Group
All above figures are for continuing operations
¹ Excluding amortisation and impairment of intangible assets (£195m) and non-underlying items (£132m)
Page 35View entire presentation