First Merchants Investor Presentation Deck
Loan Portfolio Insights
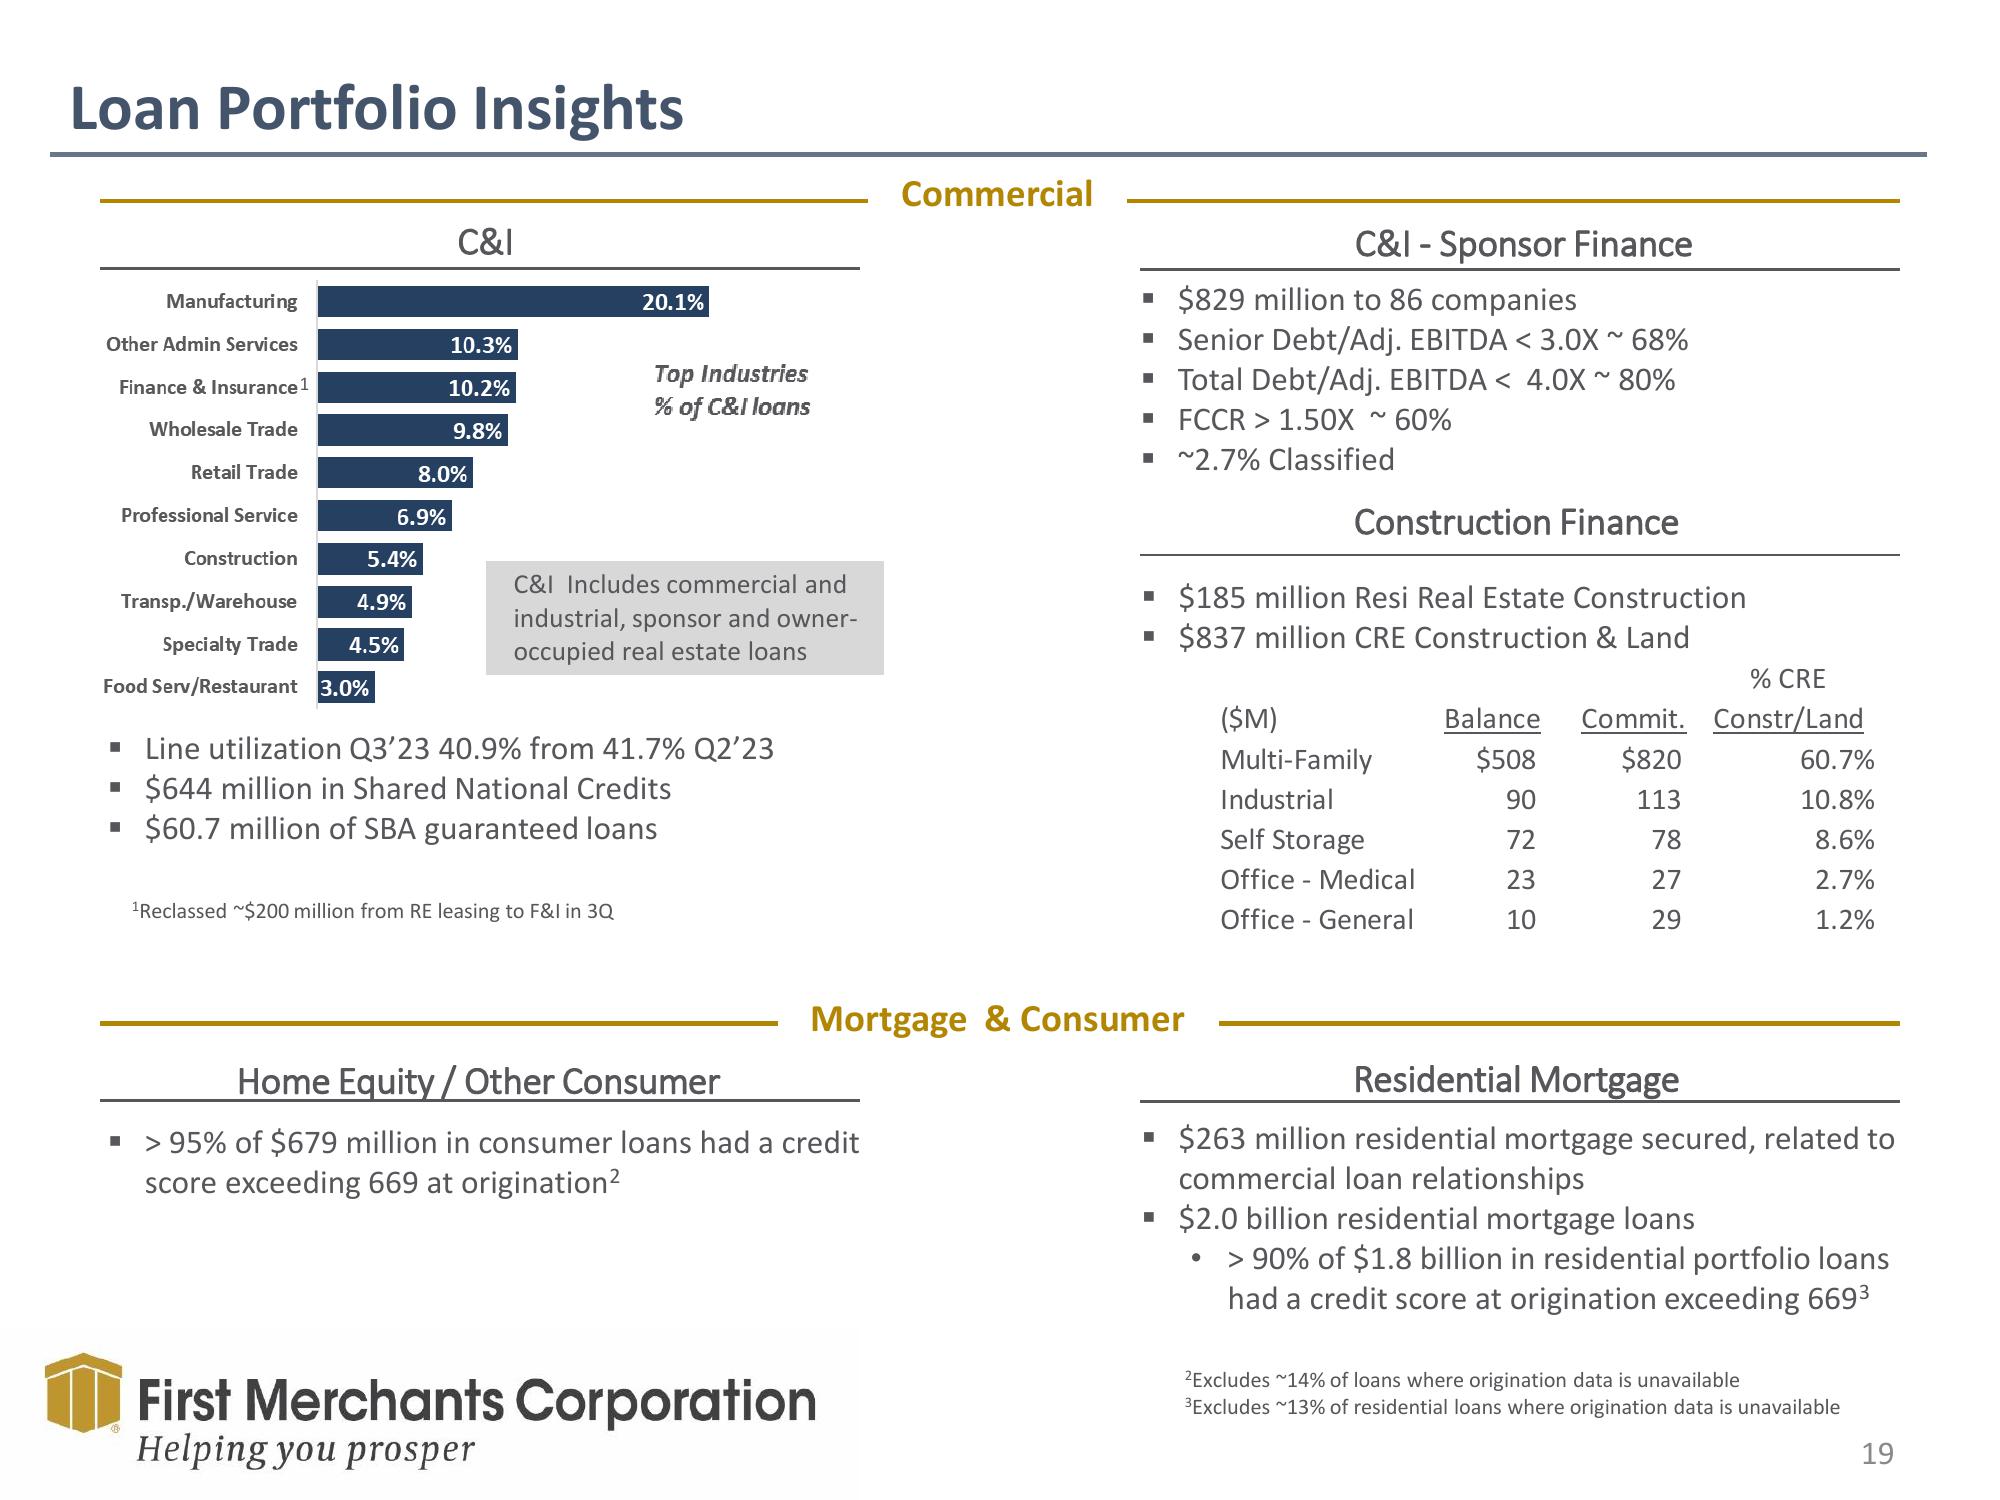
Manufacturing
Other Admin Services
Finance & Insurance 1
Wholesale Trade
Retail Trade
Professional Service
Construction
Transp./Warehouse
Specialty Trade
Food Serv/Restaurant 3.0%
■
5.4%
6.9%
4.9%
4.5%
C&I
10.3%
10.2%
9.8%
8.0%
20.1%
Top Industries
% of C&I loans
C&I Includes commercial and
industrial, sponsor and owner-
occupied real estate loans
▪ Line utilization Q3'23 40.9% from 41.7% Q2'23
$644 million in Shared National Credits
$60.7 million of SBA guaranteed loans
¹Reclassed $200 million from RE leasing to F&I in 3Q
Home Equity / Other Consumer
▪ > 95% of $679 million in consumer loans had a credit
score exceeding 669 at origination²
Commercial
First Merchants Corporation
Helping you prosper
■
$829 million to 86 companies
▪
Senior Debt/Adj. EBITDA <3.0X ~ 68%
▪ Total Debt/Adj. EBITDA < 4.0X ~ 80%
■ FCCR > 1.50X ~ 60%
■ ~2.7% Classified
Mortgage & Consumer
■
C&I - Sponsor Finance
Construction Finance
$185 million Resi Real Estate Construction
$837 million CRE Construction & Land
●
($M)
Multi-Family
Industrial
Self Storage
Office - Medical
Office General
% CRE
Balance Commit. Constr/Land
$508
$820
90
113
72
78
23
27
10
29
60.7%
10.8%
8.6%
2.7%
1.2%
Residential Mortgage
$263 million residential mortgage secured, related to
commercial loan relationships
$2.0 billion residential mortgage loans
> 90% of $1.8 billion in residential portfolio loans
had a credit score at origination exceeding 669³
²Excludes ~14% of loans where origination data is unavailable
³Excludes ~13% of residential loans where origination data is unavailable
19View entire presentation