Silicon Valley Bank Results Presentation Deck
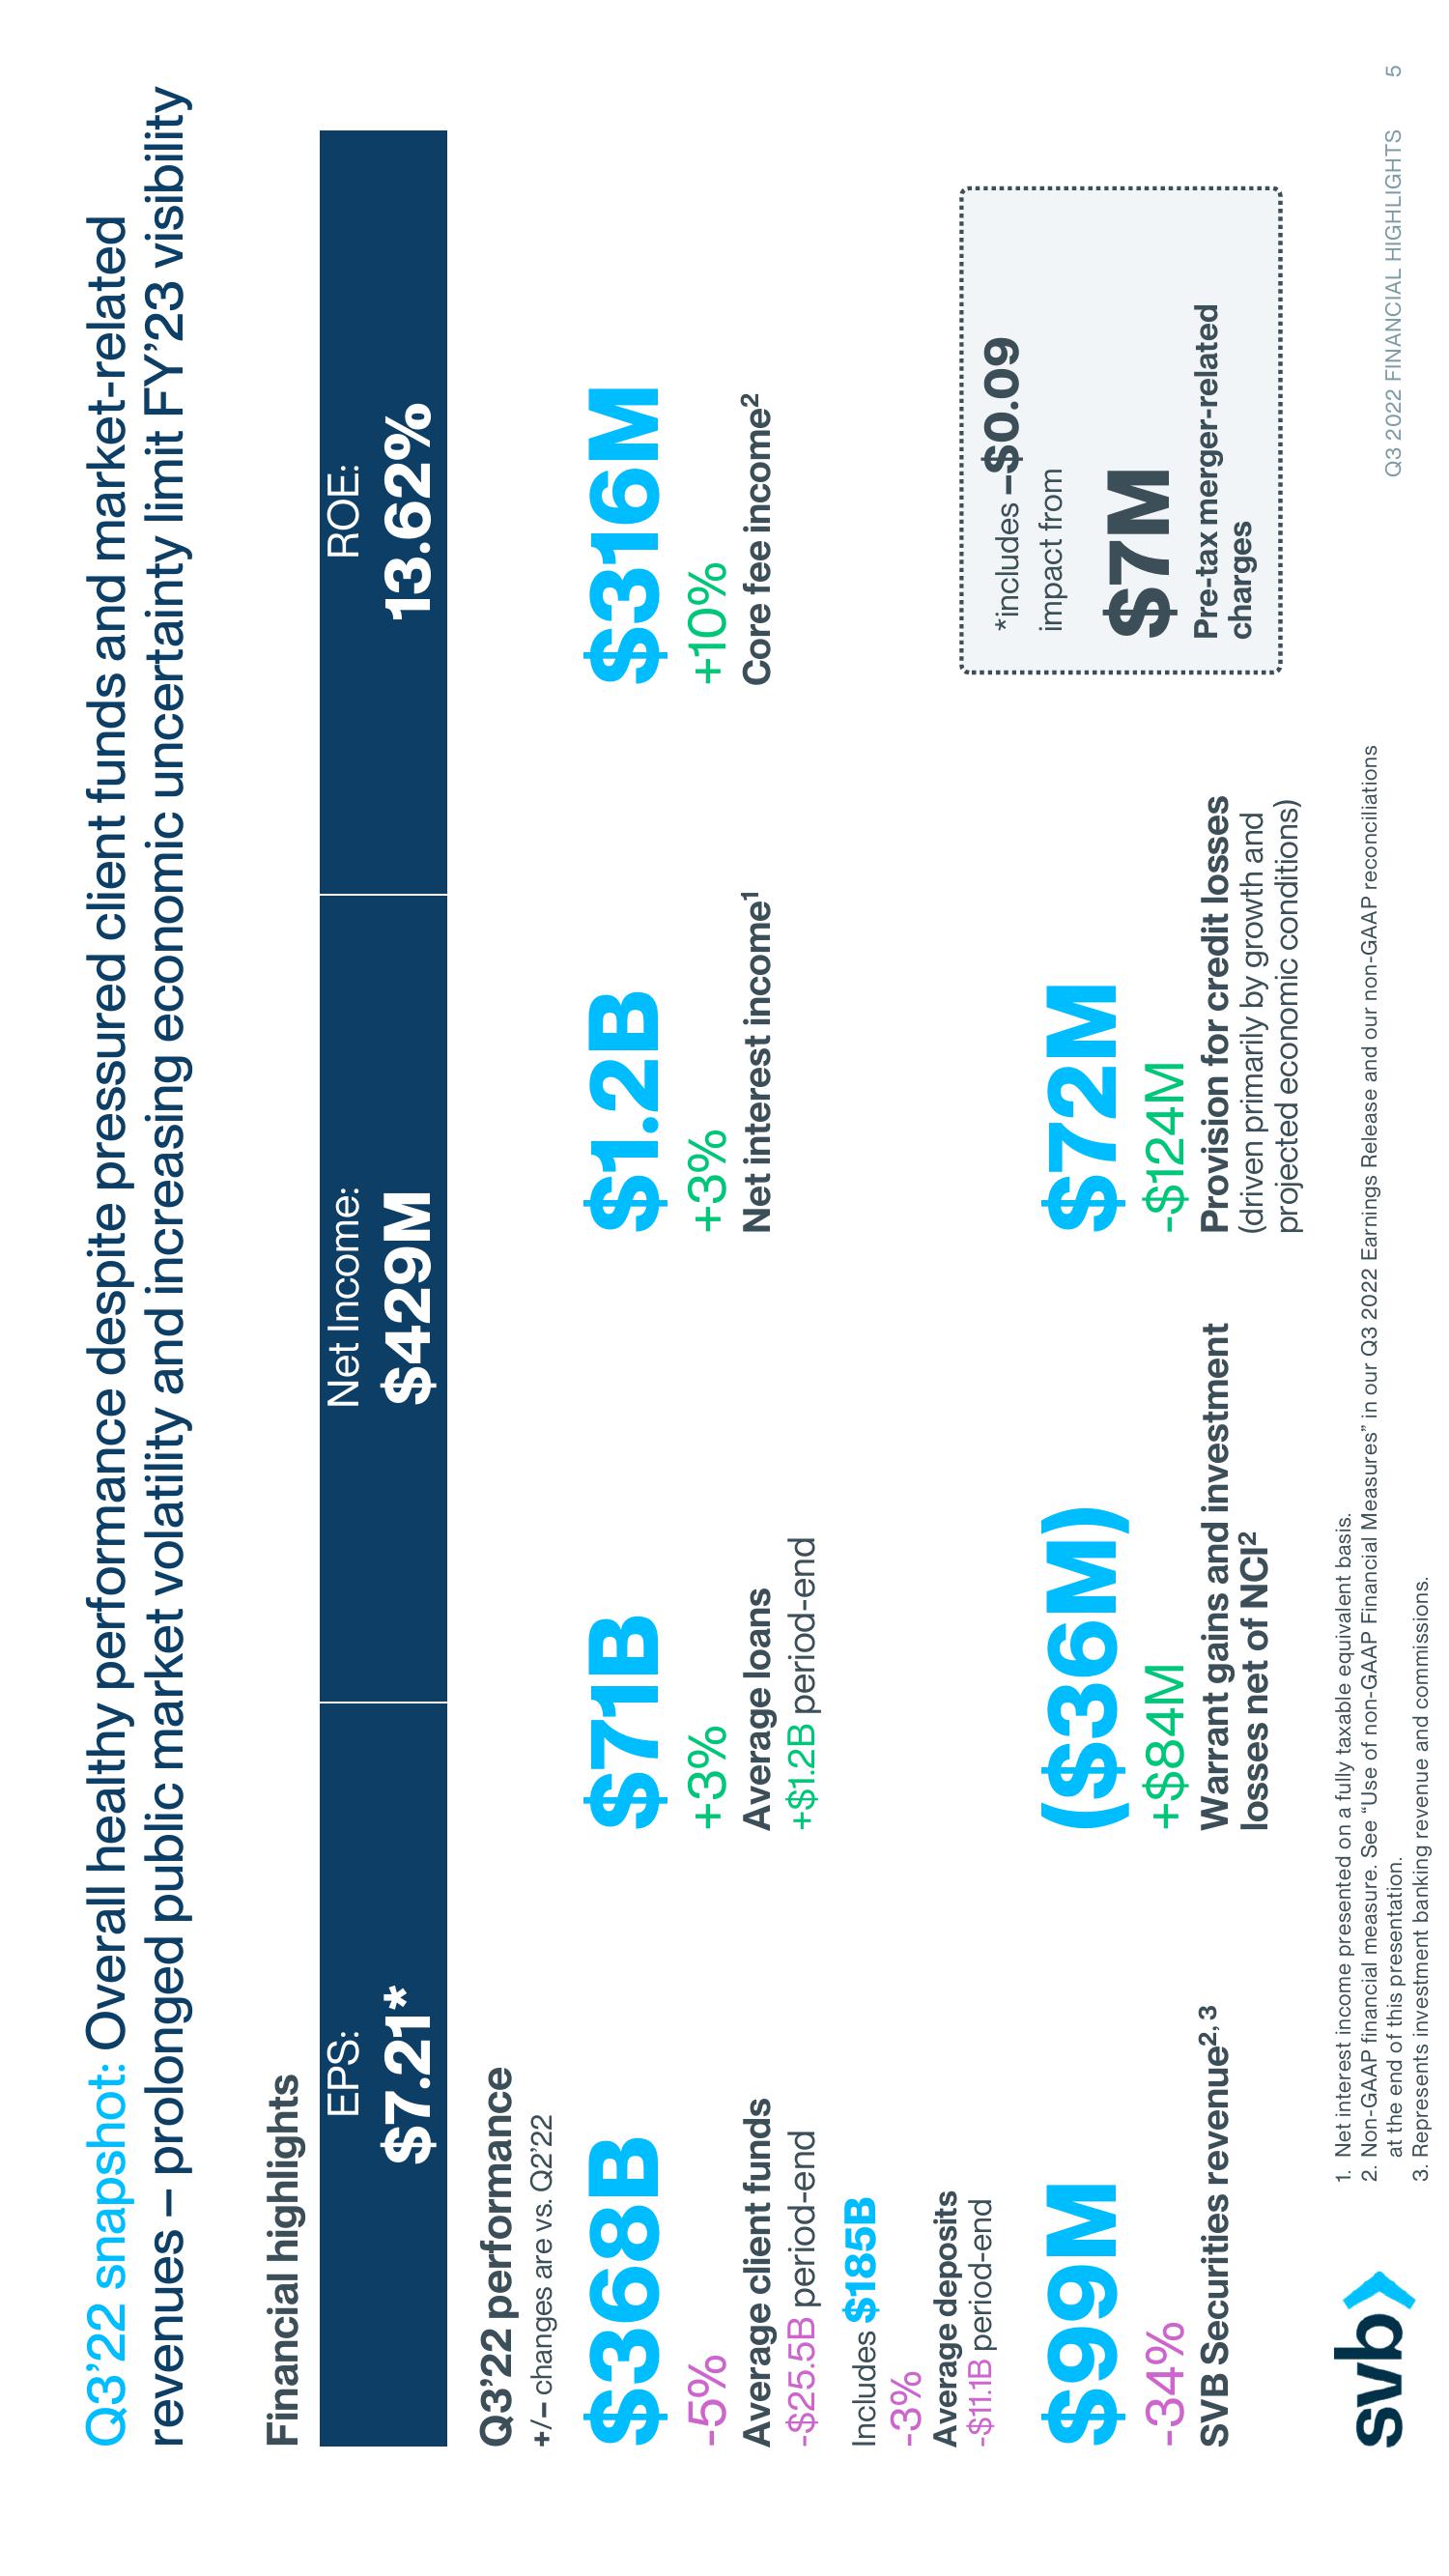
Q3'22 snapshot: Overall healthy performance despite pressured client funds and market-related
revenues - prolonged public market volatility and increasing economic uncertainty limit FY'23 visibility
Financial highlights
Q3'22 performance
+/- changes are vs. Q2'22
$368B
EPS:
$7.21*
-5%
Average client funds
-$25.5B period-end
Includes $185B
-3%
Average deposits
-$11.1B period-end
$99M
-34%
SVB Securities revenue², 3
svb>
$71B
+3%
Average loans
+$1.2B period-end
Net Income:
$429M
($36M)
+$84M
Warrant gains and investment
losses net of NCI²
$1.2B
+3%
Net interest income¹
$72M
-$124M
Provision for credit losses
(driven primarily by growth and
projected economic conditions)
1. Net interest income presented on a fully taxable equivalent basis.
2. Non-GAAP financial measure. See "Use of non-GAAP Financial Measures" in our Q3 2022 Earnings Release and our non-GAAP reconciliations
at the end of this presentation.
3. Represents investment banking revenue and commissions.
ROE:
13.62%
$316M
+10%
Core fee income²
*includes - $0.09
impact from
$7M
Pre-tax merger-related
charges
Q3 2022 FINANCIAL HIGHLIGHTS
5View entire presentation