Marti Results Presentation Deck
Business plan projections vs Actual 2022
Average Daily Vehicles Deployed
Average Daily Rides per Vehicle
Average Net Revenue per Ride (USD)
Net Revenue (USD, thousands)
Cost of Revenues, excl. Fleet Depreciation
(USD, thousands)
% of Net Revenue
G&A (USD, thousands)
% of Net Revenue
1
Adj. EBITDA (USD, thousands) ²
Adj. EBITDA Margin
2022 E
32,434
2.38
0.88
24,683
(16,444)
67%
(9,441)
38%
(804)
(3)%
2022 A
33,004
2.37
0.88
24,998
(18,636)
75%
(12,777)
51%
(3,873)
(15)%
A
2%
1%
13%
35%
(382)%
Comments
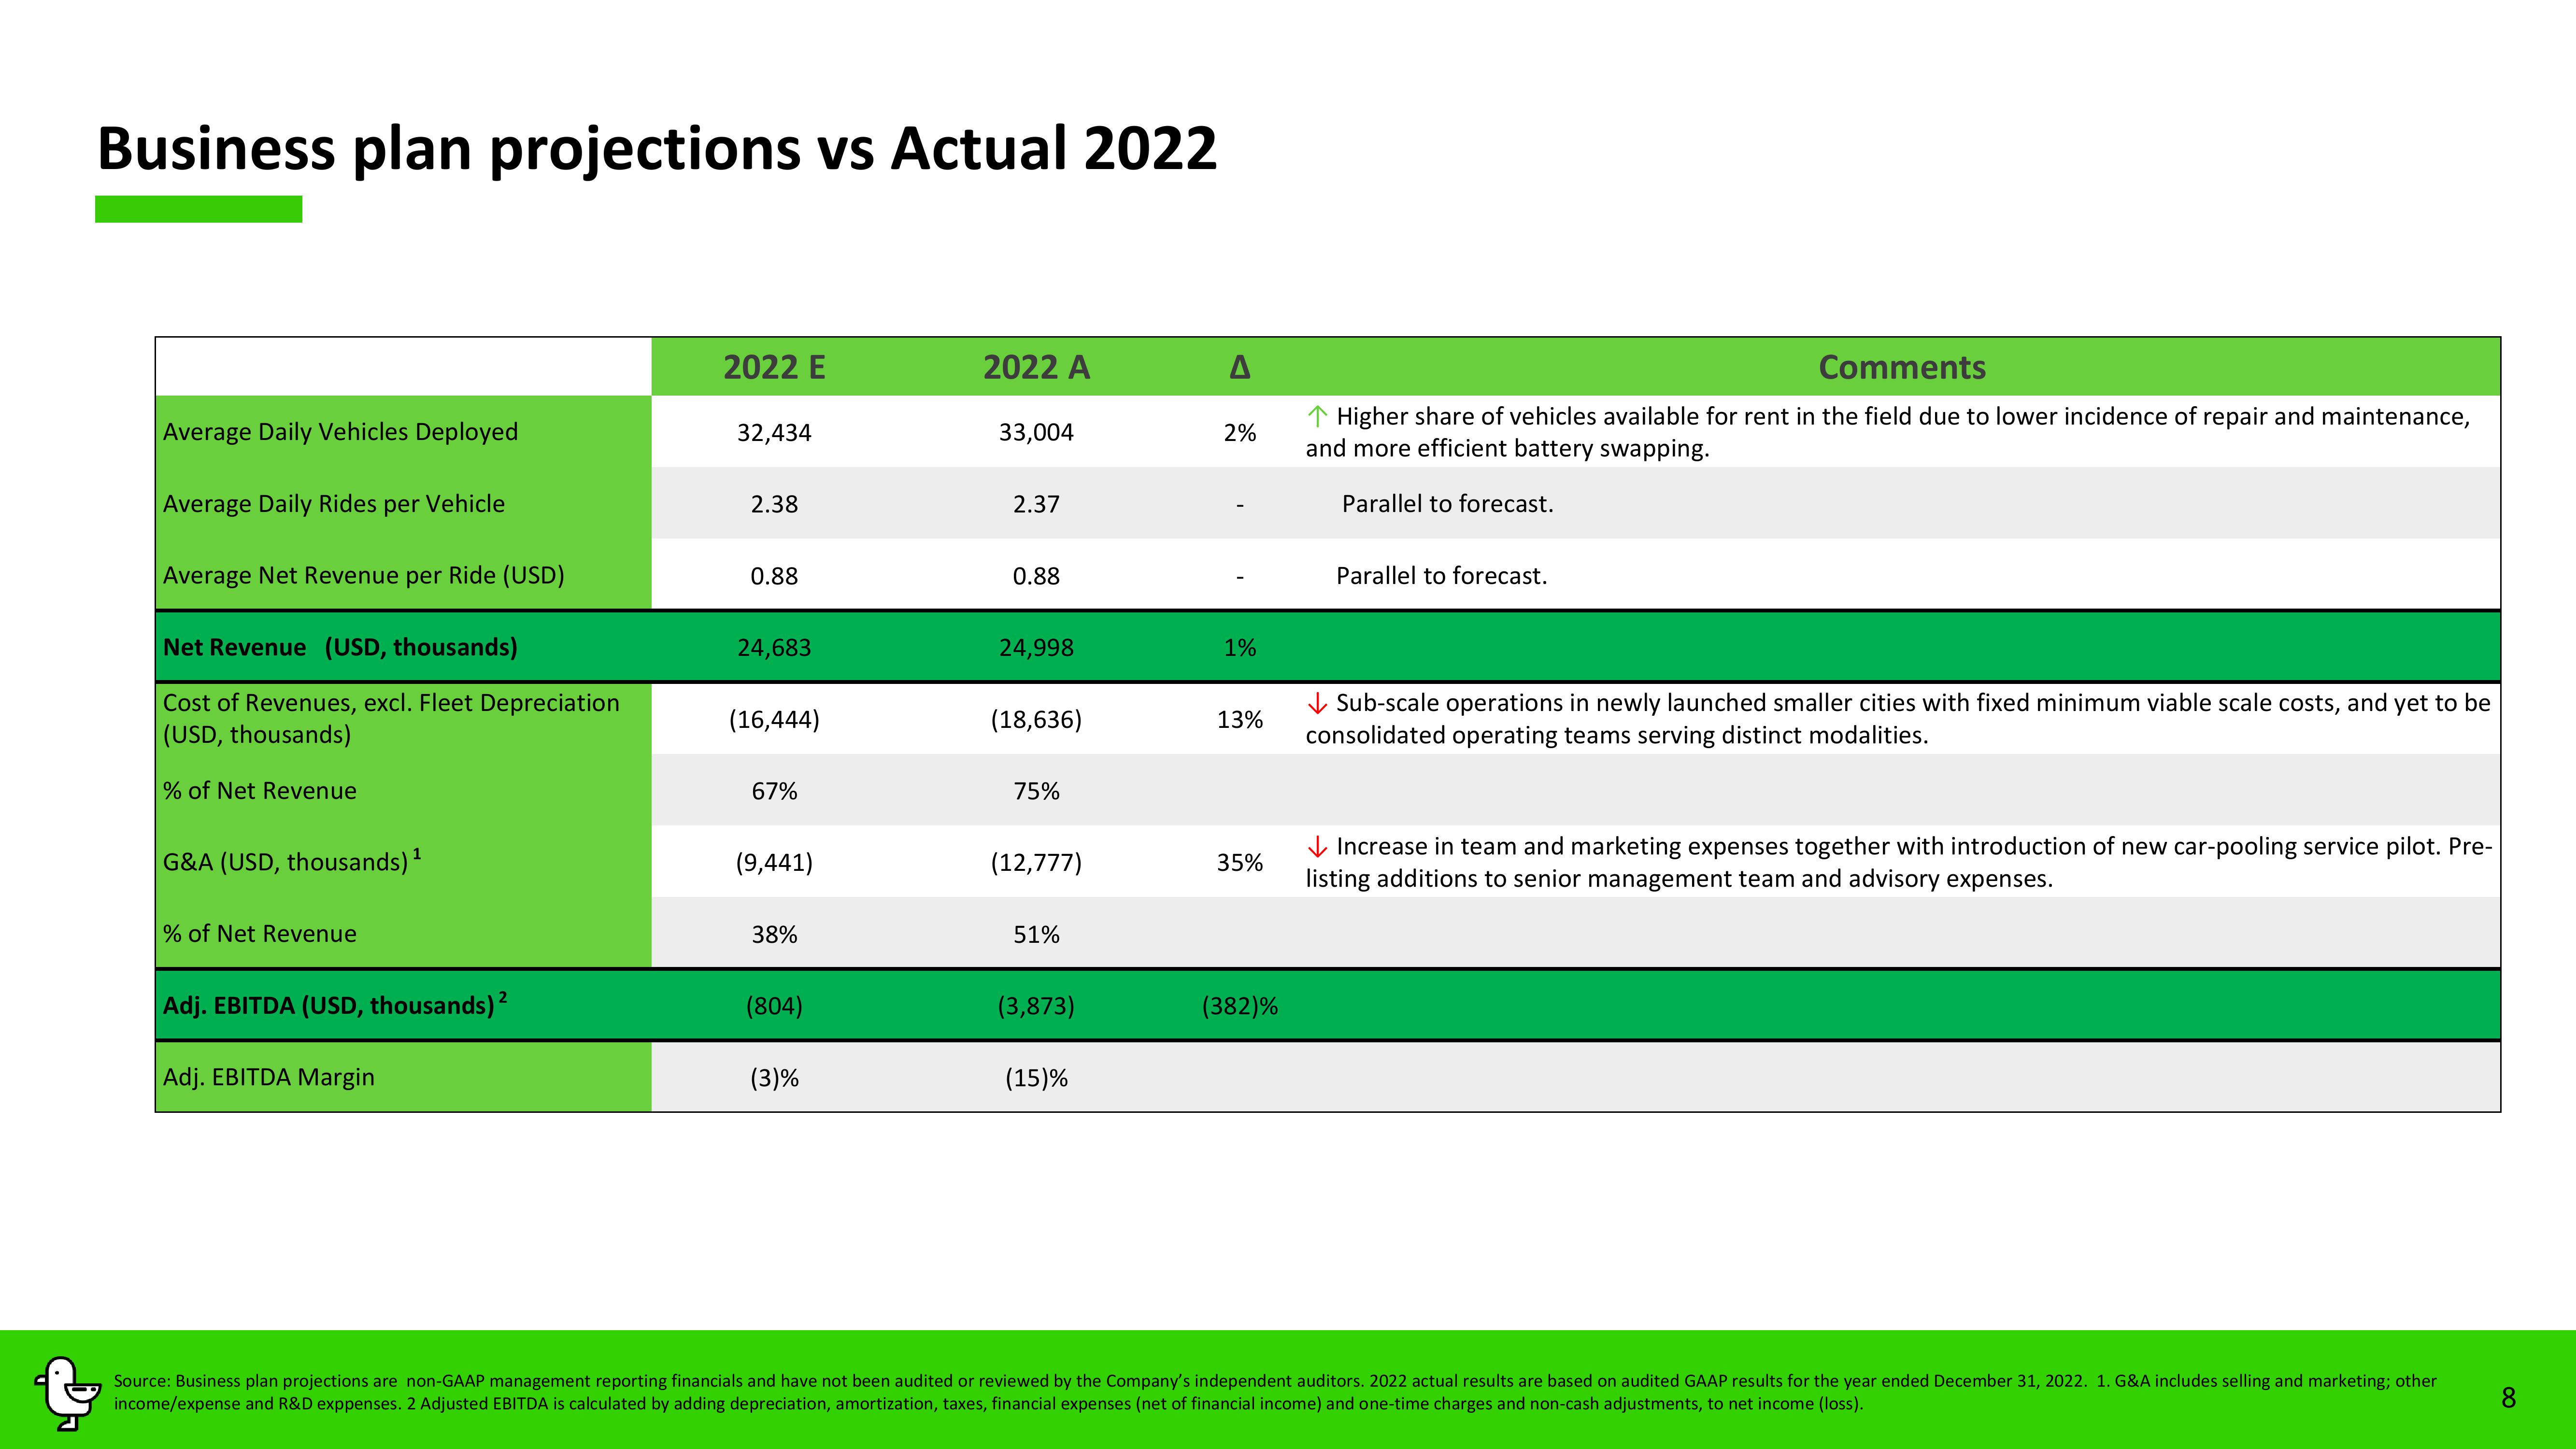
↑ Higher share of vehicles available for rent in the field due to lower incidence of repair and maintenance,
and more efficient battery swapping.
Parallel to forecast.
Parallel to forecast.
Sub-scale operations in newly launched smaller cities with fixed minimum viable scale costs, and yet to be
consolidated operating teams serving distinct modalities.
Increase in team and marketing expenses together with introduction of new car-pooling service pilot. Pre-
listing additions to senior management team and advisory expenses.
Source: Business plan projections are non-GAAP management reporting financials and have not been audited or reviewed by the Company's independent auditors. 2022 actual results are based on audited GAAP results for the year ended December 31, 2022. 1. G&A includes selling and marketing; other
income/expense and R&D exppenses. 2 Adjusted EBITDA is calculated by adding depreciation, amortization, taxes, financial expenses (net of financial income) and one-time charges and non-cash adjustments, to net income (loss).
8View entire presentation